Market Outlook 3/22/26 | EMA stack Bearish | Geopolitical Tensions
As we step into another week, markets are continuing to chop sideways, reflecting uncertainty amid rising geopolitical tensions. With former President Trump making aggressive threats towards Iran, we are faced with volatility and potential market disruptions. The situation in the Middle East is escalating, and this backdrop could keep the markets in a tight range until a clearer resolution emerges. This heightened environment has led Maya to slow down trading activity significantly, which appears to be the prudent approach as we navigate these turbulent waters. However, this dip may provide an opportunity for future gains, as many stocks have seen their valuations reset from overextended prices.
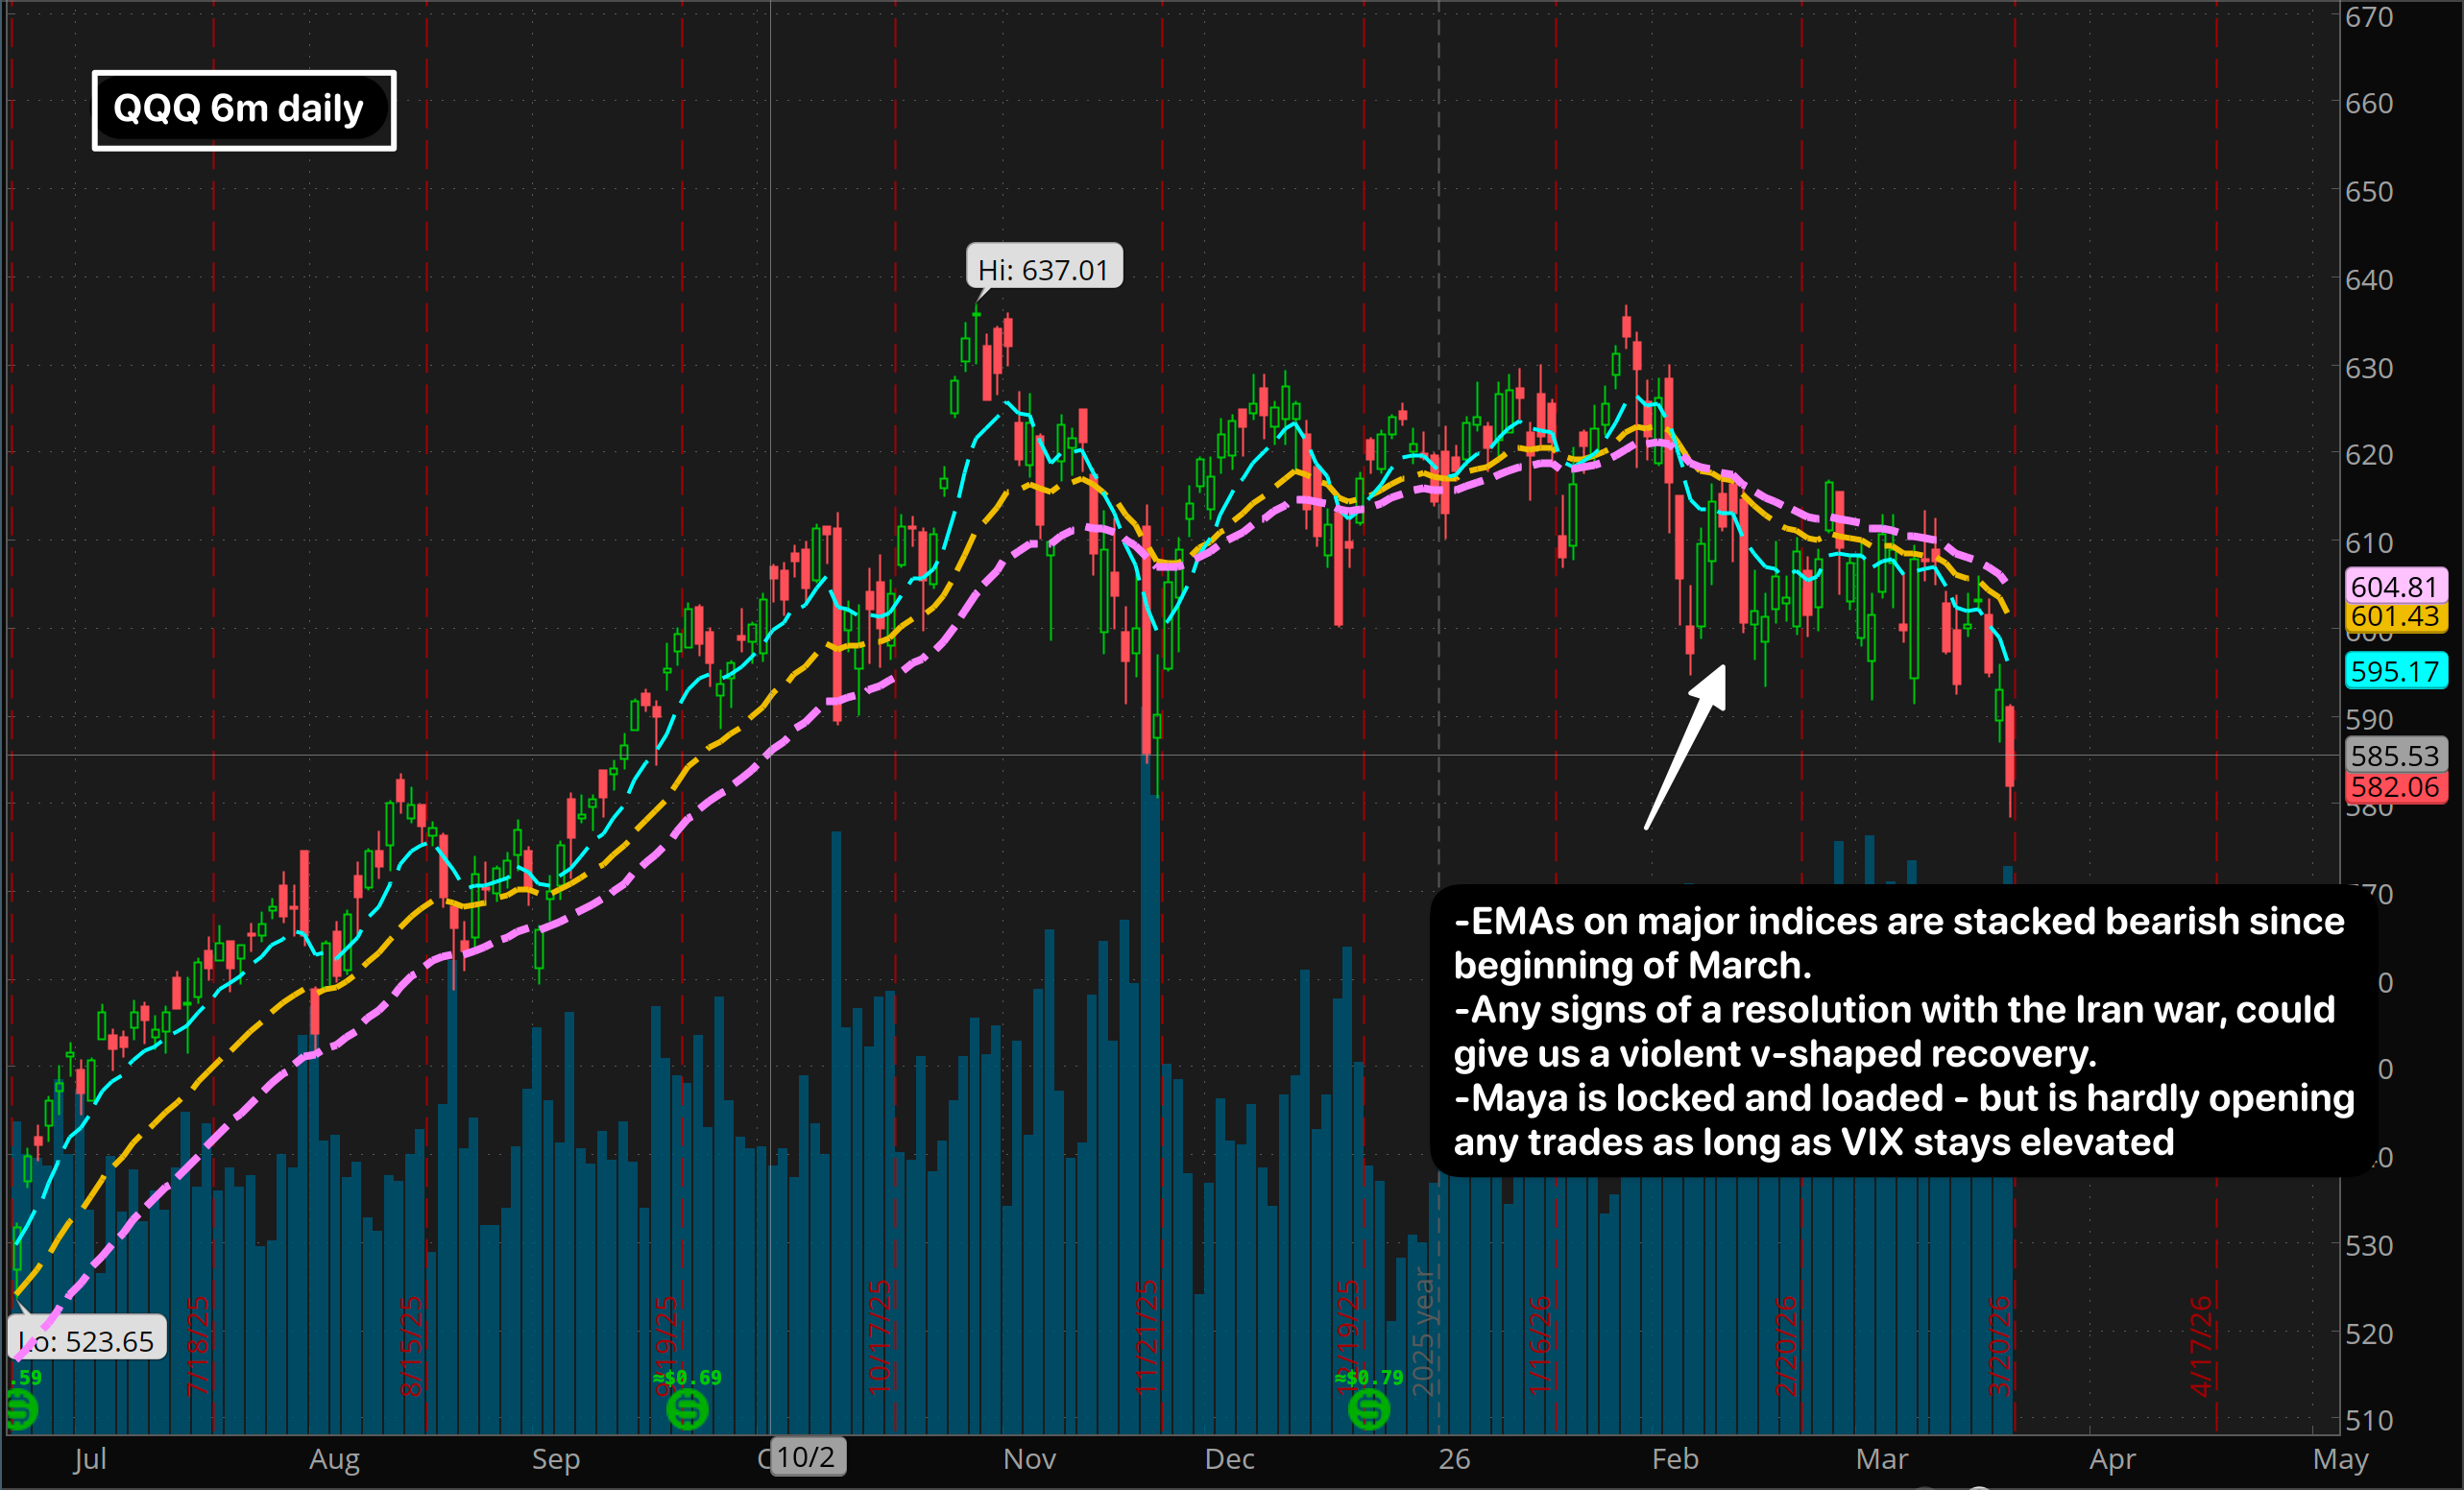
Now let's break down where we are technically. SPY closed at $648.57, which is just 7.1% from all-time highs. QQQ is at $582.06 and DIA at $455.89. The VIX, our fear gauge, is sitting at 26.78, indicating elevated levels of uncertainty in the market.
Let me walk you through everything—the technicals, the catalysts, and what it all means for our trades.
The Story So Far
Over the past quarter, we've witnessed a weak downtrend across major indices. SPY has dropped about 5.3% over three months, with a current trading range between $648.57 and $695.49. The technical setup indicates that we should be cautious, as the EMAs are stacked bearishly, with the 8-day below the 21-day, and the 21-day below the 34-day. This distribution phase suggests that sellers are in control for now.
QQQ, while slightly stronger than SPY, also reflects bearish momentum. The MACD is negative, and the RSI is approaching oversold territory, hinting at potential for a bounce. Meanwhile, DIA shows a more pronounced weakness, underperforming both SPY and QQQ with an RSI of 25.4, indicating that the market's growth sectors are still outpacing value plays.
Market breadth remains supportive, indicating that a healthy number of stocks are participating in this action, but we must remain vigilant as the overall market sentiment is still fragile. A clear signal for a trend reversal is essential before we consider adding risk back into our portfolios.
SPY Technical Analysis
📈 SPY EMA Stack (8/21/34 EMA Trend Analysis):
Legend: ■ 8 EMA (fast) ■ 21 EMA (medium) ■ 34 EMA (slow)
SPY closed at $648.57, remaining below all major EMAs, which indicates a bearish alignment. The 8-day EMA is at $659.99, the 21-day at $670.61, and the 34-day at $676.43. This setup suggests that we are still in a distribution phase, which could extend as long as geopolitical tensions remain unresolved.
The RSI is currently at 30.0, approaching oversold levels, which may entice buyers to step in soon. However, the negative MACD at -1.8466 shows that bearish momentum is still in play. Additionally, SPY's price is below the lower Bollinger Band, reinforcing the notion that there could be a bounce potential in the near term, but caution is warranted due to the prevailing bearish trend.
QQQ - Tech Sector Check
QQQ is showing slightly better relative strength, currently priced at $582.06. However, the MACD continues to reflect bearish momentum with a histogram at -2.0851. The EMAs are also stacked bearishly, suggesting that we need to tread carefully in the tech sector.
Despite this, there is potential for an oversold bounce given the current market conditions. The tech sector has historically shown resilience, and if we see any stabilization in broader market sentiment, we may find opportunities for entry in this space.
DIA - Dow Check
DIA, trading at $455.89, is lagging behind SPY and QQQ. The RSI of 25.4 confirms that the Dow is under pressure, and the negative MACD reflects continued bearish sentiment. This underperformance could signal a shift towards growth sectors, indicating that we should focus on where the strength lies rather than forcing trades in weaker areas.
Market Breadth - NYSE A/D Line
📊 Market Breadth & Index Overview:
💡 Market Breadth Tip: Healthy rallies show broad participation across sectors. Watch for divergences - when indices rise but breadth weakens, it can signal a narrowing rally. Visit Market Conditions for detailed A/D analysis.
The market breadth remains supportive, indicating that a considerable portion of stocks is participating in the current action. This healthy uptrend suggests resilience, but we must continue to monitor the A/D line for any signs of divergence that could foreshadow a reversal.
Sector Rotation & Heatmap
📊 S&P 500 Sector Heatmap (click sectors to expand):
📈 Sector ETFs Performance:
Currently, Energy (no surprises!) and Utilities sectors are leading the market, which is what happens during risk-off environments. Here’s how the sectors are performing:
- Leading: Energy (XLE), Utilities (XLU), Communication Services (XLC)
- Improving: Financials (XLF), Technology (XLK)
- Weakening: Materials (XLB), Consumer Staples (XLP)
- Lagging: Consumer Discretionary (XLY), Real Estate (XLRE)
Given this rotation, we should focus our trades in the leading sectors while being cautious of those that are weakening.
VIX - The Fear Gauge
The VIX is currently at 26.78, indicating elevated fear in the market. In this environment, it's crucial to size positions smaller to manage risk effectively.
Economic Calendar
📅 Economic Calendar (click events for details):
This week brings some critical economic data that could impact market movements. Key reports include:
- Tuesday, Mar 24: S&P Global Manufacturing PMI
- Tuesday, Mar 24: S&P Global Services PMI
- Thursday, Mar 26: Initial Jobless Claims
These reports can signal economic strength or weakness, influencing Fed policy and overall market sentiment. Position sizing should be adjusted ahead of these major releases to mitigate potential volatility.
Earnings Calendar
"Here's the full breakdown of earnings this week - I've highlighted the ones that could really move the market:"
| Day | Symbol | Company | Time | Impact |
|---|---|---|---|---|
| Wednesday, Mar 25 |  MKC MKC |
MKC Corp. | After Market | 🟡 |
| Thursday, Mar 26 |  CTAS CTAS |
CTAS Corp. | After Market | 🟡 |
 DLTR DLTR |
DLTR Corp. | After Market | 🟡 | |
 PAYX PAYX |
PAYX Corp. | After Market | 🟡 | |
| Friday, Mar 27 |  LULU LULU |
LULU Corp. | After Market | 🟡 |
This week’s earnings calendar features critical reports from MKC on Wednesday, CTAS, DLTR, and PAYX on Thursday, and LULU on Friday. These earnings reports could be pivotal, especially in the current market climate, where company performance will be scrutinized closely for signals of economic health.
My Game Plan
Given the current market conditions, this is not the time to be aggressive. With the VIX elevated and geopolitical risks looming, I am tightening stops and taking profits on any positions that are up more than 4%. If SPY breaks below $640, I will consider moving to cash. It’s crucial to preserve capital until we see clearer signals for a recovery.
What Maya Can Do For You
Maya's risk management is a key differentiator in today's volatile market. Maya's sophisticated exit rules help cut losses early and protect gains effectively. For example, with a profit target of 94% ROI, Maya locks in gains while minimizing risks through early exits when momentum shifts.
This systematic approach means losses remain manageable, even during downturns. If you’re looking to improve your trading outcomes and avoid emotional decision-making, Maya's disciplined monitoring could provide the strategy you need.
Maya generates these returns because the system follows emotionless, rules-based exits. In choppy or down markets, Maya's exit rules prioritize capital preservation; when the right environment shows up, the system presses its edge and captures outsized gains.
Share this post
Comments 0
Leave a Comment
No comments yet. Be the first to comment!
Stay Updated
Subscribe to our newsletter for the latest trading insights and updates.
Autotrading is Live
Maya sends the signals. PeakBot submits the orders to your brokerage. You never lift a finger.
See How It Works