That TradingView Indicator Is Not a Trading System
That TradingView Indicator Is Not a Trading System
An arrow on a chart answers one question. A real trading system answers all of them, before you ever open a position.
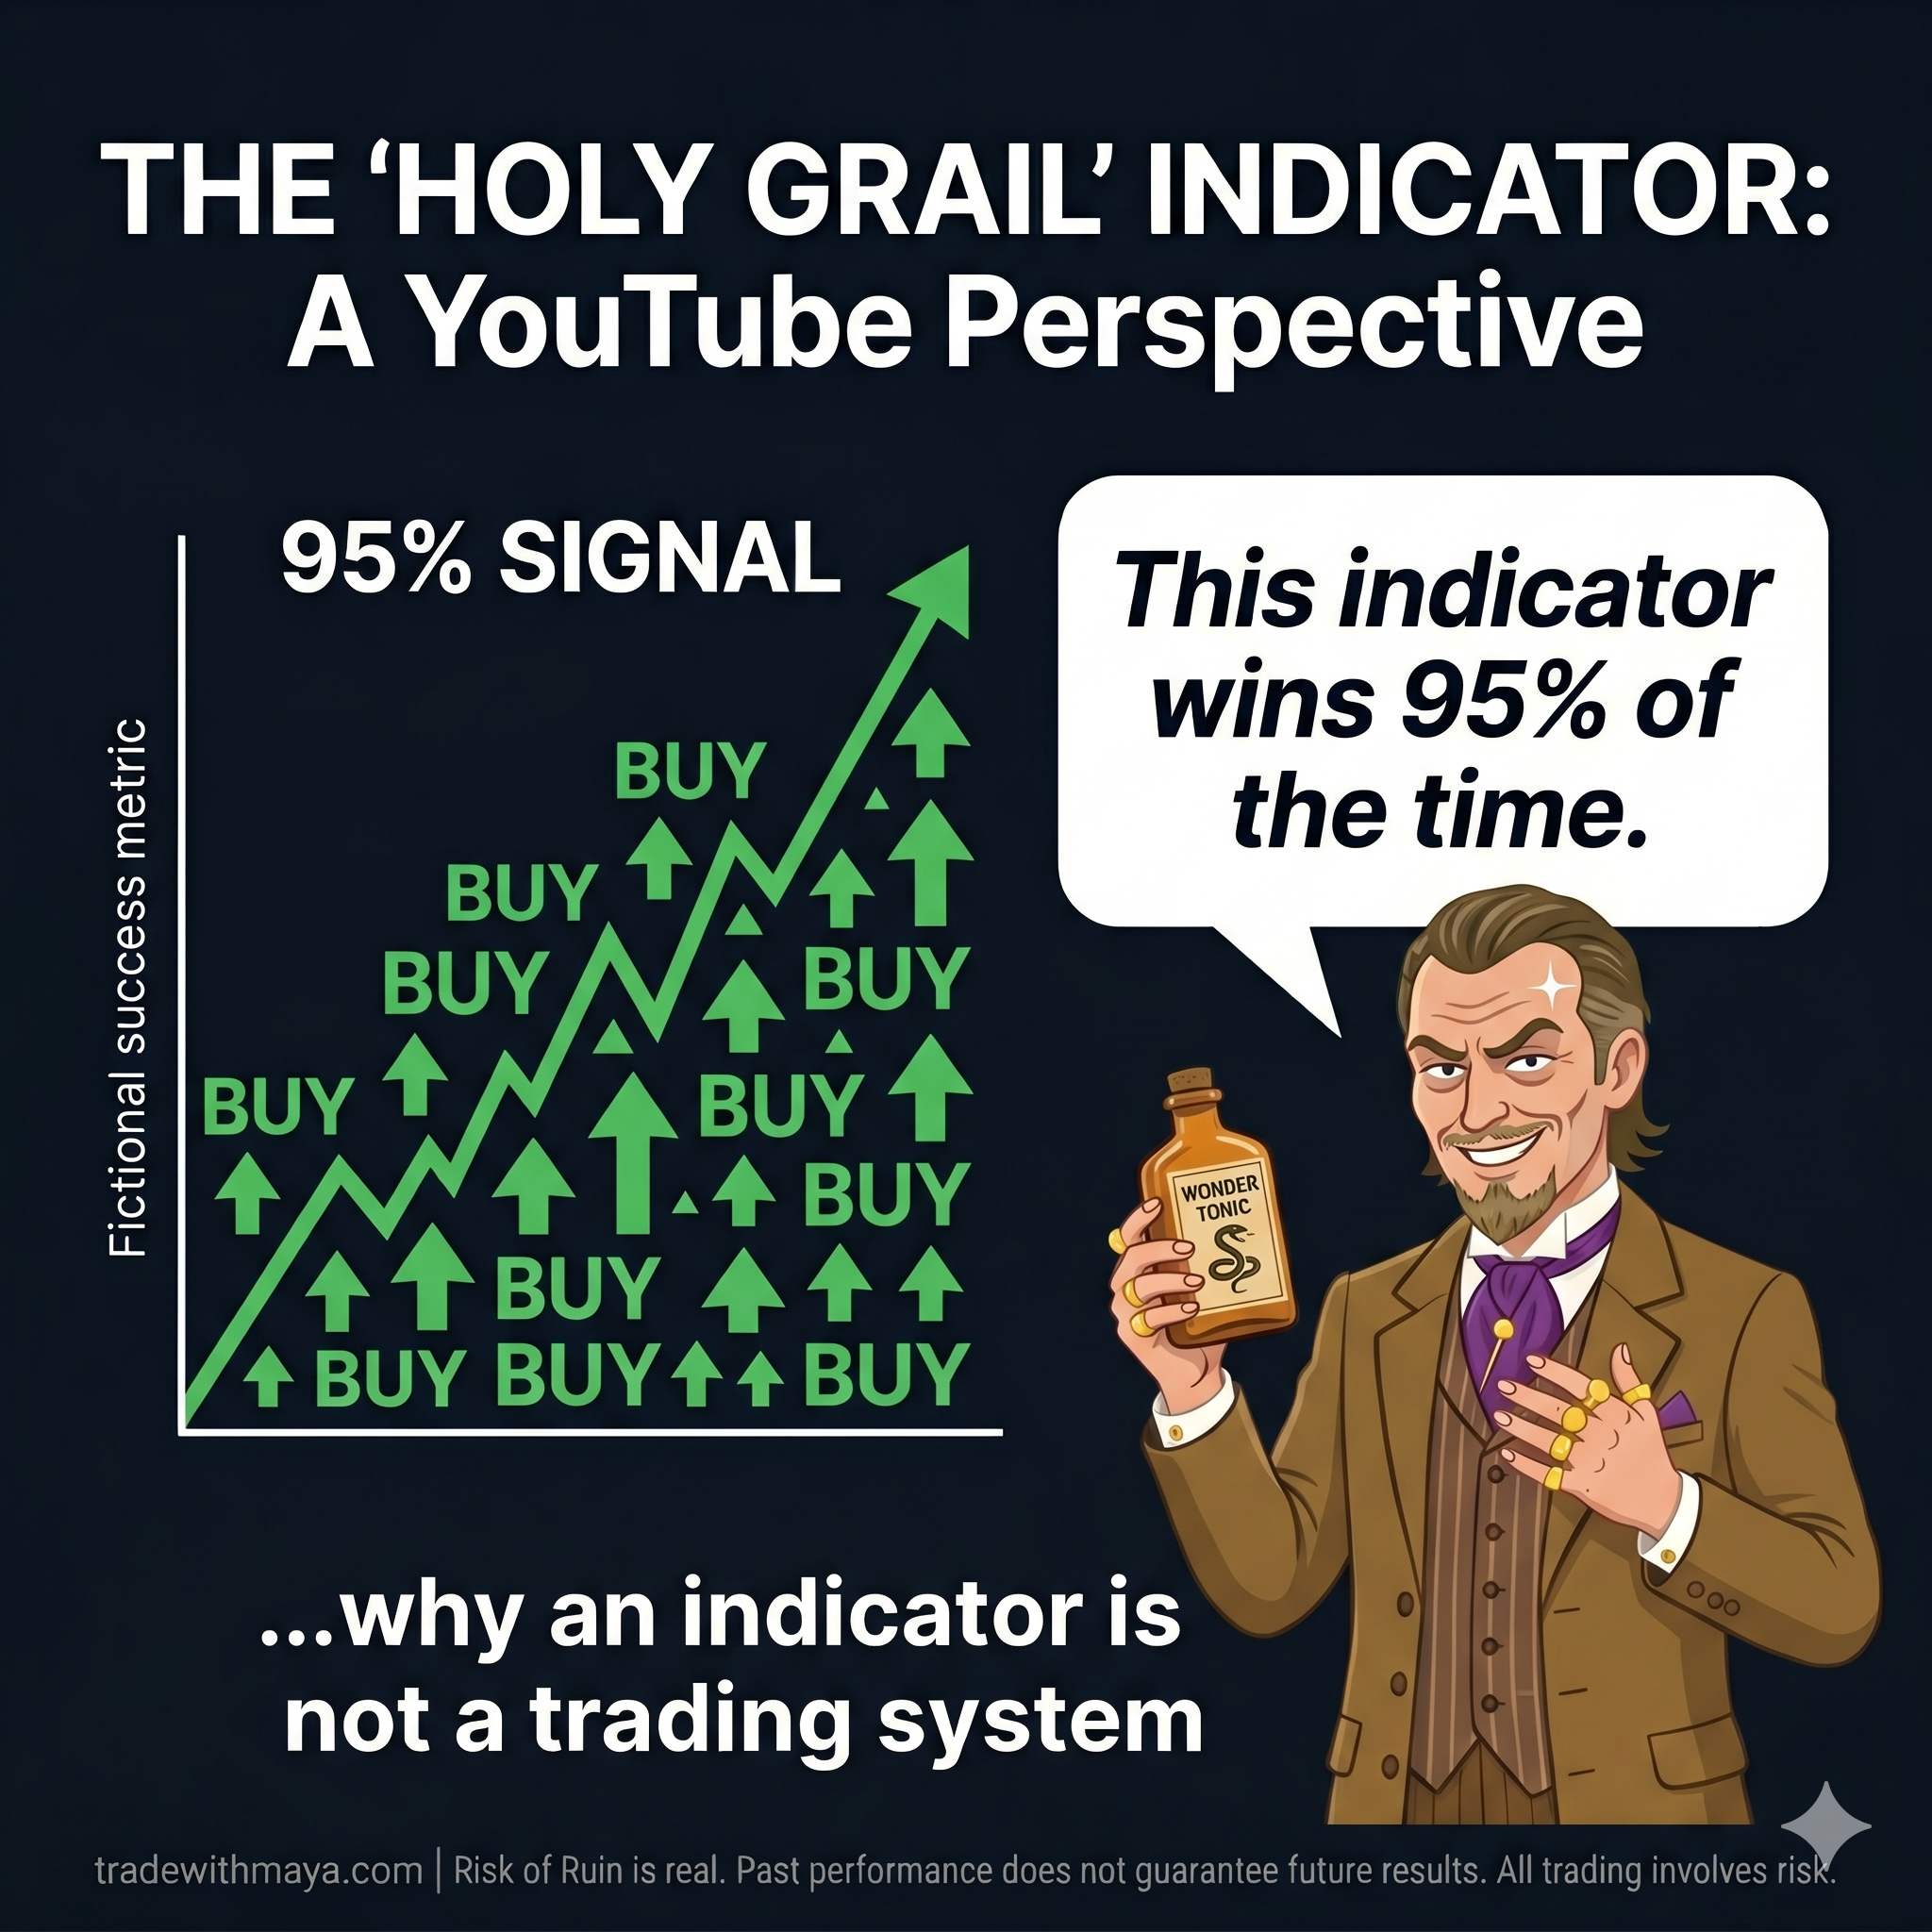
There's a formula that has completely taken over YouTube's financial content. Someone pulls up a chart, drops an indicator on it, and shows you 8 trades from the last three months where the arrows pointed up right before the stock moved higher. "90% win rate," the title says. In the comments, hundreds of people ask how much they actually made trading it live. The creator never answers. Ever.
The reason they don't answer is that an arrow on a chart isn't a trading system. It was never close to being one. And once you understand the difference, those videos become very hard to watch with a straight face.
Let's Get Back to the Casino
I like to start with a real-world analogy before diving into the technical stuff, so bear with me for a minute because this one makes everything else click.
Sit down at a blackjack table with $500. With basic strategy you're playing against roughly a 0.5% house edge (nearly a coin flip, about as fair as casino games get). Play $250 a hand and even a nearly fair game goes wrong four times in a row often enough to wipe you out before you've ordered your second drink. The math never got a chance to play out. Play $10 a hand with the same $500 and you can absorb 50 bad hands, keep playing, and let the edge do its job over time. Nothing about the game changed between those two versions of the night. Bet size was the only variable.
Now add one more layer. Halfway through the night, the casino turns the lights down, the dealer starts shuffling twice as fast, and half the table is drunk and making chaotic bets. The right strategy under those conditions isn't the same as when everything was calm. A real player notices the environment changed and adjusts. An indicator doesn't even notice the lights went off.
That's markets. No risk means no reward, obvious enough. Take the right amount of risk in the right conditions and you open the door to returns, though nothing is ever guaranteed. Take too much risk, or any risk in the wrong environment, and a bad stretch ends your ability to keep playing before the edge gets to prove itself. An indicator has no concept of which environment you're in. It draws the same arrow regardless.
The Top-Down Approach: There's a Lot Happening Before We Ever Touch a Stock
Here's something that might surprise you about how Maya actually works. Before the algorithm ever looks at a single stock, it does something most retail traders skip entirely: it reads the room.
Think of it like a pilot before a flight. A good pilot doesn't walk up to the plane, confirm the engines start, and immediately taxi to the runway. They check the weather at the destination, the weather along the route, the winds at altitude, and the runway conditions, including whether any of it changed in the last hour. The fact that the plane works is almost a footnote. The go/no-go decision is made before anyone boards.
Maya works the same way, in five layers, from broad to specific:
Maya's Top-Down Framework: Five Steps Before a Single Trade Opens
STEP 1 - MARKET REGIME
Are we broadly in a bull market or a bear market? Not vibes, actual moving average relationships and trend direction across multiple timeframes. This sets the foundation for everything else.
STEP 2 - MARKET INDICES
What is the S&P 500 doing? What is the Nasdaq doing? A rising tide lifts all boats, but a falling tide sinks them regardless of how good any individual stock looks on a chart. Maya checks the tide before picking the boat.
STEP 3 - THE FEAR INDEX (VIX)
The VIX measures how stressed the market is. A calm VIX and a spiking VIX are completely different operating environments. Sizing positions identically in both is like driving at 90mph whether you're on a clear highway or in a snowstorm.
STEP 4 - EXPOSURE DECISION
Based on the three layers above, how much capital should be deployed right now? Not a fixed number. A live answer to a live question, recalculated on every single cycle.
STEP 5 - ONLY NOW: INDIVIDUAL STOCKS
With the macro picture established and the right exposure level set, the algorithm finally looks for individual trades: stocks that pass MACD alignment, RSI levels, sector positioning, and trend direction. If nothing qualifies, nothing opens. Waiting is a valid position.
Most indicators skip steps one through four entirely. They start at step five and end at step five. Whatever is happening above that (macro environment, volatility regime, how much of your capital is already at risk) is completely invisible to them and entirely your problem. The indicator doesn't watch the news. It doesn't know it's 2022 and tech is down 35% for the year. It sees a pattern and draws an arrow, blissfully unaware of everything else.
The Hardest Part: You Never Know It's a Bear Market Until It's Already Eaten You
Nobody rings a bell at the top. In January 2022, financial media was still describing every pullback as "healthy consolidation" and a "buy the dip opportunity." By October, after the Nasdaq had fallen 35%, everyone suddenly remembered it had been a bear market the whole time. The bear didn't announce itself in January. It was just cold outside and people were still in t-shirts.
This is the real complexity of regime detection that most trading systems pretend doesn't exist. It's trivially easy to look at a historical chart and say "2022 was a bear market." Making that call correctly in real time, in the middle of it, while financial Twitter is still debating whether this is just a correction, that's the hard part. And getting it wrong has consequences that tend to wipe out years of gains in a matter of months.
Bull markets are forgiving. Buy the dip. Stocks bounce. Every pullback looks like an opportunity and, more often than not, it is. Three years of consistent gains can start to feel like you've figured something out. But a lot of that return isn't your strategy performing, it's the market carrying you upward and your strategy not getting in the way. The test is what happens when the market stops cooperating.
The way Maya handles this is worth explaining carefully, because the solution isn't to call the bear market at all. It's to build something that doesn't need to.
Maya reads multiple signals simultaneously rather than waiting for any single one to confirm. When the 50-day moving average on the S&P crosses below the 200-day, the trend has changed character, and that's a mechanical signal that doesn't require interpretation. When VIX starts rising from a calm baseline, rising fear is itself a warning regardless of where the absolute level sits. When defensive sectors like utilities, consumer staples, and healthcare start leading while growth and tech lag, the market is rotating to safety before the news headlines announce why. When the broad index MACD turns negative, momentum has shifted. No single signal makes the call on its own. They compound, and as more of them flip unfavorable, Maya's exposure drops incrementally in response.
By the time CNBC runs the "Is This a Bear Market?" graphic, Maya has usually been reducing exposure for several weeks, guided by signals that don't need a headline to trigger. And if the signals turn out to be wrong, if what looked like early bear market conditions is just a sharp correction that reverses, the system dials exposure back up as conditions normalize. No ego, no conviction, no digging in. Just a mechanical response to what the data shows right now.
The goal isn't to be the smartest person in the room about where markets are headed.
It's to never be the last person to notice the environment changed. A system that can only make money in bull markets isn't a trading system, it's a bull market participation vehicle. Those are easy to build and easy to sell. They're also easy to blow up when conditions shift.
What the Exposure Decision Actually Looks Like
Once Maya has assessed the regime, the indices, and the fear index, it decides how much capital to deploy. Here's what that looks like in practice, and notice how dramatically the numbers shift as conditions deteriorate:
RSI overbought conditions and defensive sector rotation layer additional reductions on top of the VIX rules, and they stack. The system doesn't pick the most conservative signal and stop there; it applies them all. On any given cycle, the exposure decision is the product of everything the market is telling us simultaneously, not a single number someone hard-coded two years ago.
The Exit Problem
This is where most retail traders quietly destroy accounts that were otherwise doing fine. The indicator pointed you in. Getting out is entirely on you. Most people hold losers too long because selling feels like giving up, and bail on winners too early because unrealized profits make them nervous. Neither of those is a system, and both of them wreck the math.
Maya runs nine distinct exit triggers on every open position, checked in priority order on every cycle. The first two cover dividend risk on the short call and a profit target: once the trade hits 94% ROI, it closes. The next handles positions that are still early in their cycle, blocking premature exits unless the loss is already severe. As expiration approaches and gamma risk rises, a DTE-based stop tightens the loss threshold automatically. If the trade is underwater past the hard stop floor, it closes regardless of timing. The PNR (Point of No Return) check models where price needs to hold based on the distance to the long strike, days remaining, and current volatility, a dynamic floor that adjusts to conditions rather than a fixed number. The expiry week rule forces a close by Wednesday if the position is still open in the final week before expiration. And the last two are MACD reversal signals (one on the broad market via QQQ, one on the individual stock), both using live VIX levels to determine how far the underlying needs to fall before the exit fires, naturally tightening the trigger in volatile markets and widening it when conditions are calm.
Backtesting: The Real Kind, Not the YouTube Kind
There are backtesting platforms that will optimize your strategy to a 95% win rate on any historical period you choose. You adjust a few parameters, click "optimize," and the software finds the exact settings that would have worked perfectly on that specific data. Congratulations, you didn't discover a strategy. You memorized an exam. It's the difference between a student who got hold of the exact test questions beforehand and a student who actually understood the subject. The first one passes. The second one knows what to do when the questions change.
This is called curve fitting, and it's everywhere in the retail trading space. A 10-line AI-generated Pine Script, optimized against six months of SPY data, tweaked until it showed a flattering win rate, packaged with a dramatic backtest chart, and sold as a "complete trading system." If you've ever bought one of those and been thoroughly disappointed by live results, now you know exactly why. The strategy worked on the specific historical period it was trained on. That's not the same as working in markets.
Then there are Monte Carlo simulations, which are a step beyond historical backtesting that most retail platforms don't offer and almost no system sellers bother to run, because the results are more honest than flattering.
A historical backtest tells you how one specific sequence of events played out: the actual trades, in the actual order they happened, in the actual years they occurred. That's useful, but history only gives you one sequence. Monte Carlo takes the same pool of trade outcomes and shuffles them into thousands of different orderings. What happens if your first 30 trades are all losers instead of mixed? What if the worst drawdown comes in month two, before the account has had time to compound? What's the absolute worst realistic version of this strategy across every possible ordering of the same outcomes?
Think of it the way engineers stress-test a bridge. They don't calculate only for the average load on a normal day. They calculate for the worst possible combination: maximum traffic, peak wind, a truck 20% over the weight limit, all hitting at once. They want to know what fails first and at what point. Monte Carlo for a trading strategy works the same way. You're not looking for the most likely outcome, you're looking for the worst credible one, and checking whether the system survives it.
This is what separates a properly validated strategy from a script with a pretty chart. Anyone can find parameters that worked on past data. Very few take the time to ask what the worst realistic version of this looks like across thousands of simulated scenarios, and whether the system is still standing on the other side of it. That question is what gave us confidence to put real capital behind Maya. Not because the backtest looked good, but because after 10 years of historical data and thousands of Monte Carlo runs, the worst credible outcome was a recoverable drawdown, not an account wipeout.
One Question, or All of Them
A real trading system has one job: answer every question the signal leaves open. What is the broad market regime right now? What are the indices telling us? How stressed is the environment, and how does that change the exposure? When does the trade close if it works? When does it close if it doesn't? How does the system behave when it can't tell yet whether a correction is a dip or the start of a bear market, and how does it protect the portfolio if it turns out to be the latter? What does performance look like across 10+ years of real history and thousands of randomized simulations, not the three good months someone chose to show on YouTube?
An indicator answers exactly one of those: did this pattern appear on the chart just now? Everything else is on you. A trading system answers all of them before you ever open a position. That's the difference, and it's the entire difference.
Maya's full trade history, including every losing trade and every exit reason, is on the public tracker. That's the standard any system should meet before it touches real capital: complete transparency, live results across multiple market regimes, nothing hidden and nothing cherry-picked.
See the Full System in Action
Every trade, every exit, every losing position, all on the live tracker. No cherry-picking, no highlight reels. The complete record across bull markets, bear markets, and everything in between.
View Maya's Track RecordShare this post
Comments 0
Leave a Comment
No comments yet. Be the first to comment!
Stay Updated
Subscribe to our newsletter for the latest trading insights and updates.
Autotrading is Live
Maya sends the signals. PeakBot submits the orders to your brokerage. You never lift a finger.
See How It Works