The AI Trade Just Hit a Wall. Here Is What Past Corrections Tell Us
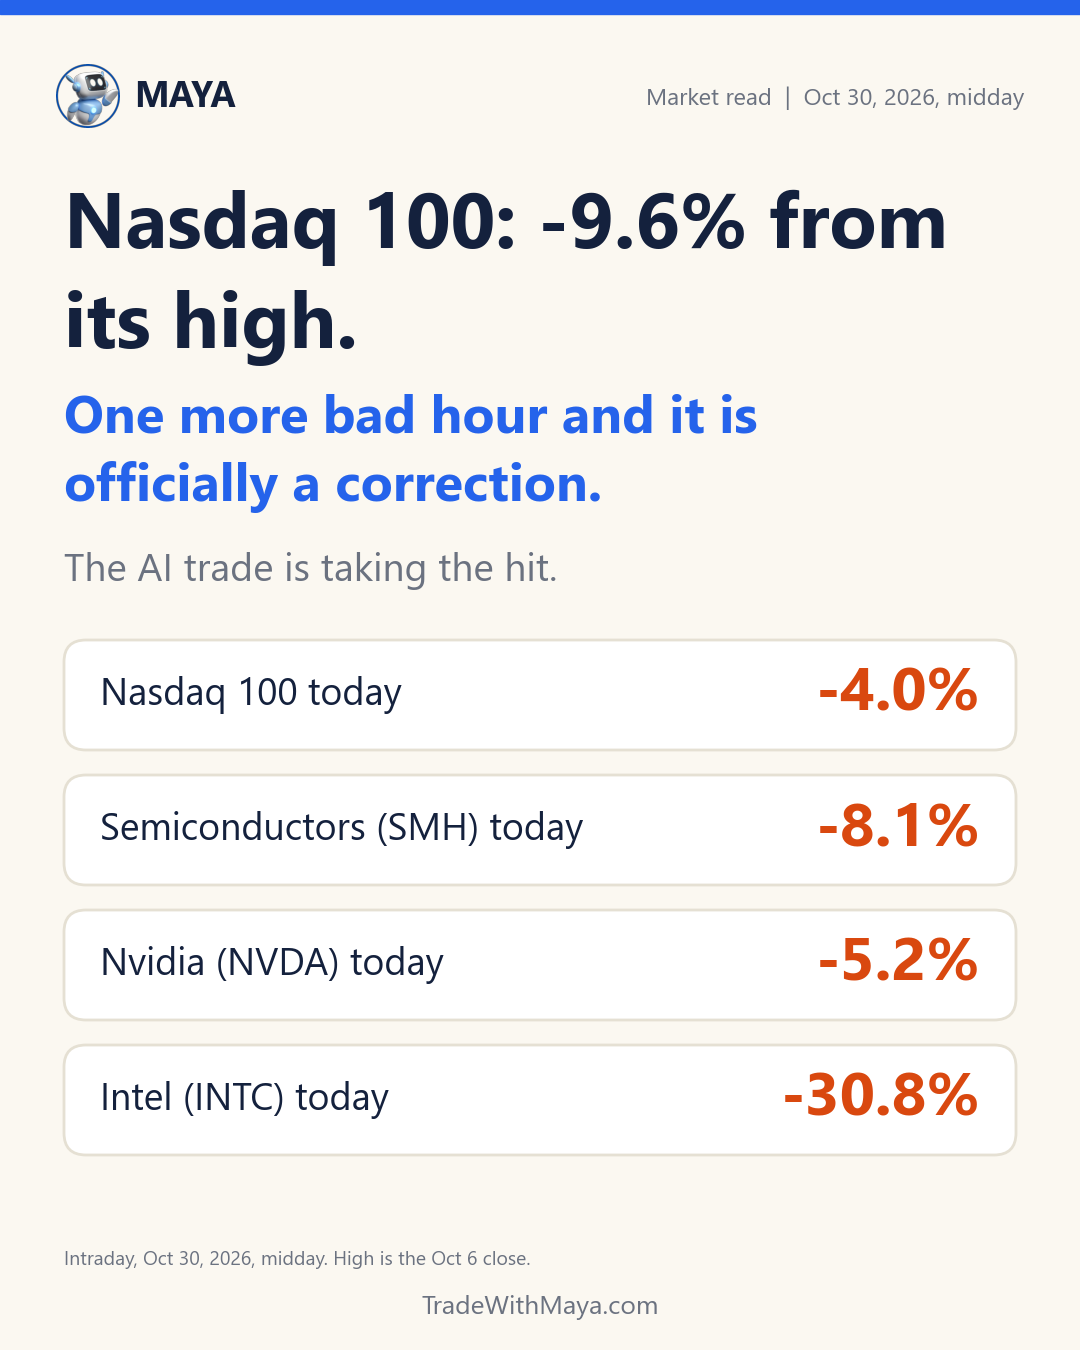
I have been watching the screen all morning and it is hard to look away. Intel is down about 30%, Nvidia is down about 5%, and the Nasdaq 100 is sliding toward what traders call a correction. Friday, meet Monday.
What is actually going on
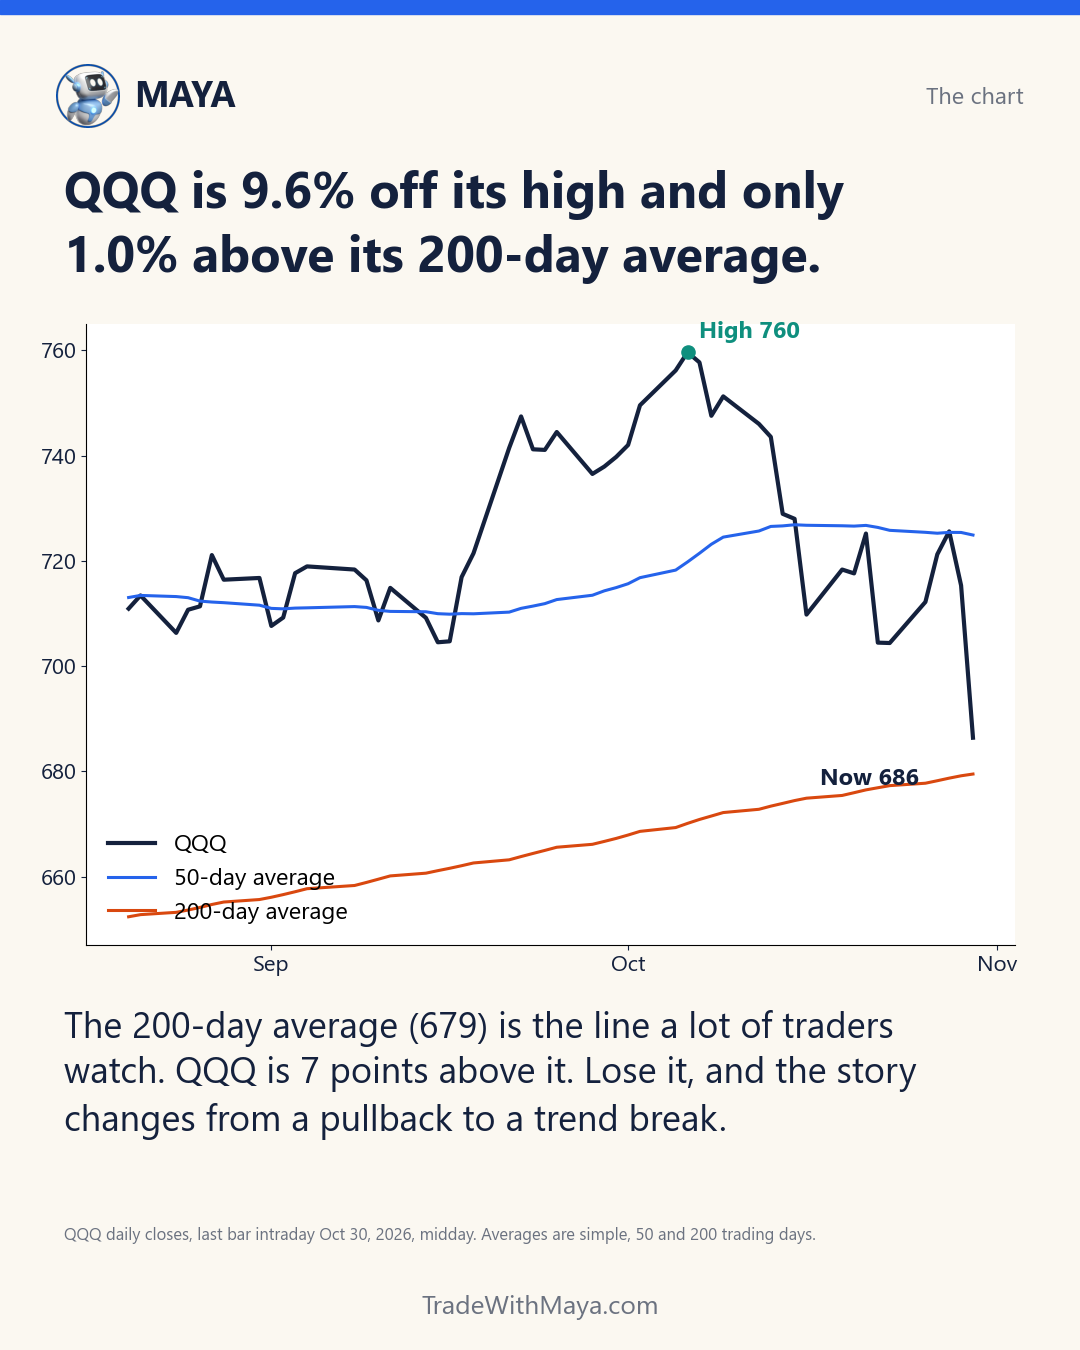
Alphabet got hit yesterday. This morning Amazon missed and Intel gave a weak outlook, and the whole AI group got dragged down with them. Intel is down about 30%, which is the kind of move I usually associate with a bankruptcy rumor, not a chip giant. The Nasdaq 100 is now about 9.6% below its Oct 6 high, a hair away from the 10% mark everyone calls a correction.
Here is what I want you to notice, though. The S&P 500 is only about 3% off its high, while the chip stocks are down 23% from theirs. This is one crowded trade getting repriced, not the whole market falling apart.
I have seen this movie before
I have been trading since 2006, and the thing nobody tells you early on is that corrections are normal. At Maya we do everything based on data, so I went back and counted. Since 1985 the Nasdaq 100 has had 34 pullbacks of 10% or more. That is roughly one a year.
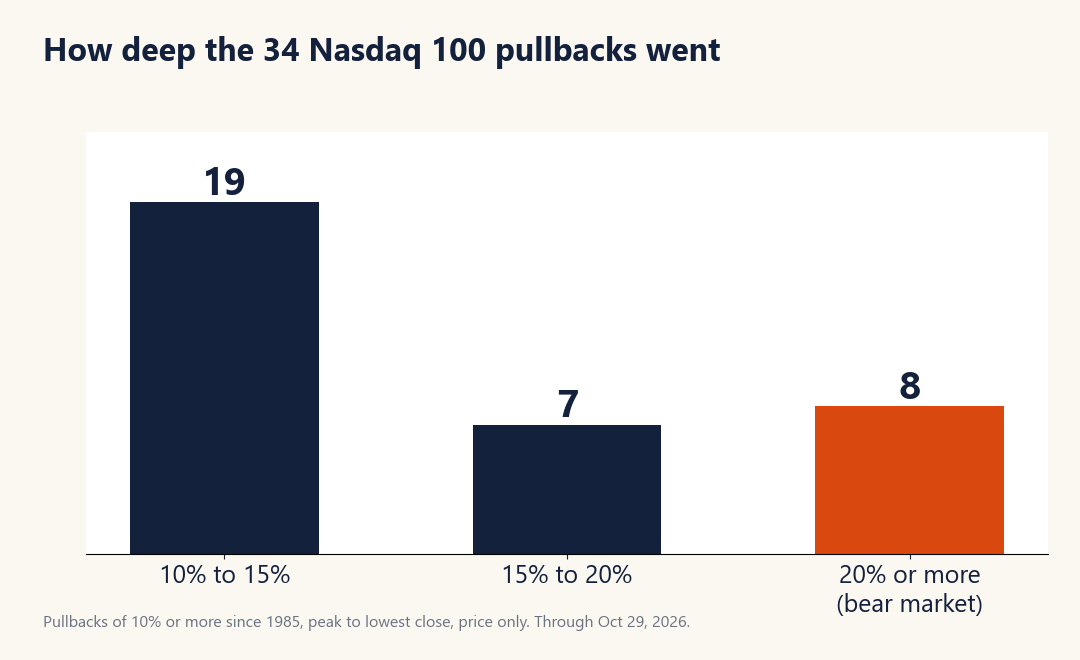
Most of them were the garden variety. Down for a couple of months, back to the old high a couple of months after that. A handful, 8 out of 34, kept going and turned into real bear markets, like 2000 and 2022. I will not pretend to know which kind this is, and neither does anyone on TV.
What I can tell you is what usually happened next. A year after the Nasdaq 100 first closed 10% below its high, it was higher about 81% of the time, and the typical gain was around 26%. The exception was the dot-com bust, which is why you never go all in on a hunch.
What our own records show
This is the part I care about most, because it is our money and our trades, not a textbook. We have been live since April 2025, and we have been through two Nasdaq 100 corrections since then.
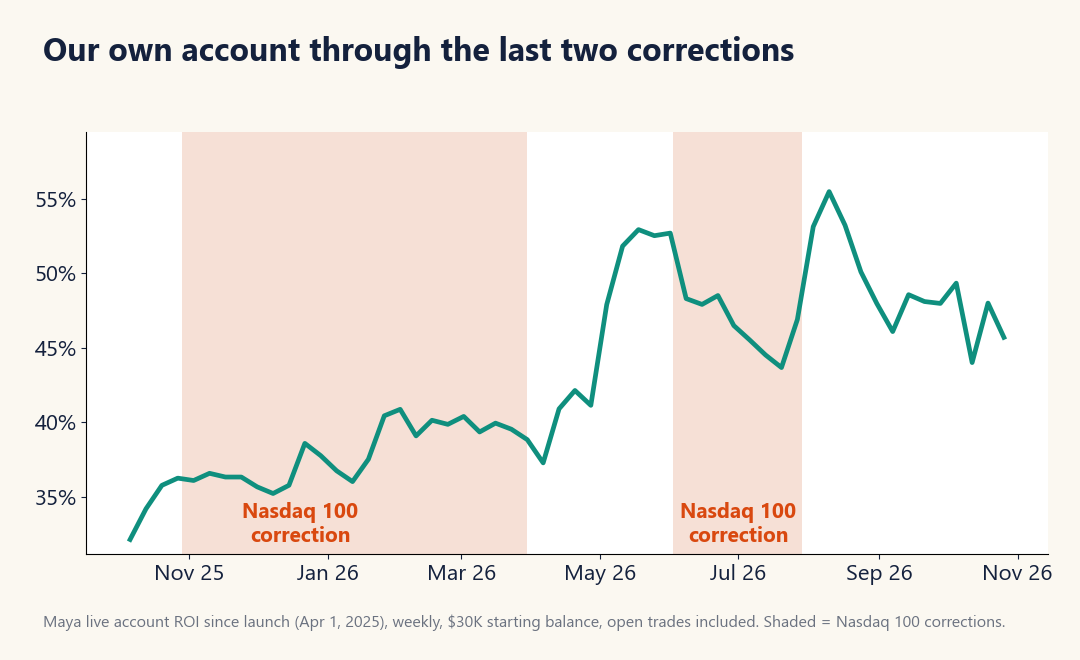
The first ran from last October to March, about 12% down over five months. Our account was higher at the bottom than when it started. The second was this summer. We gave back some ground, about 9 points of ROI between June and July, and then had all of it back, and more, within two weeks of the bottom. I am not telling you that to brag. I am telling you because the rules did the work and I stayed out of their way.
That is the whole philosophy. When the market gets stressed, the system scales its exposure down. When it settles, it scales back up. No hero trades, no panic.
What I am watching, and what I expect
I watch one line right now: QQQ's 200-day average, around 679. QQQ is only about 1% above it. If it holds, this looks like a hard pullback. If it breaks, I get a lot less relaxed.
My honest expectation is bumpy for a few weeks. Apple reports Monday after the close and the midterms are Tuesday, so do not be surprised by big swings. If you are sitting on cash, do not chase the first bounce. If you are fully invested, check that your position sizes are ones you can sleep with. That is my read, not advice.
Share this post
Comments 0
Leave a Comment
No comments yet. Be the first to comment!
Stay Updated
Subscribe to our newsletter for the latest trading insights and updates.
Autotrading is Live
Maya sends the signals. PeakBot submits the orders to your brokerage. You never lift a finger.
See How It Works