New book, out now

Trade Like a Machine

A step-by-step guide to building a rules-based options trading system. No hunches and no guru worship, just rules you can write down, test, and follow.

Get it on Amazon See what's inside
Available now in paperback and on Kindle. Choose your format on the Amazon page.
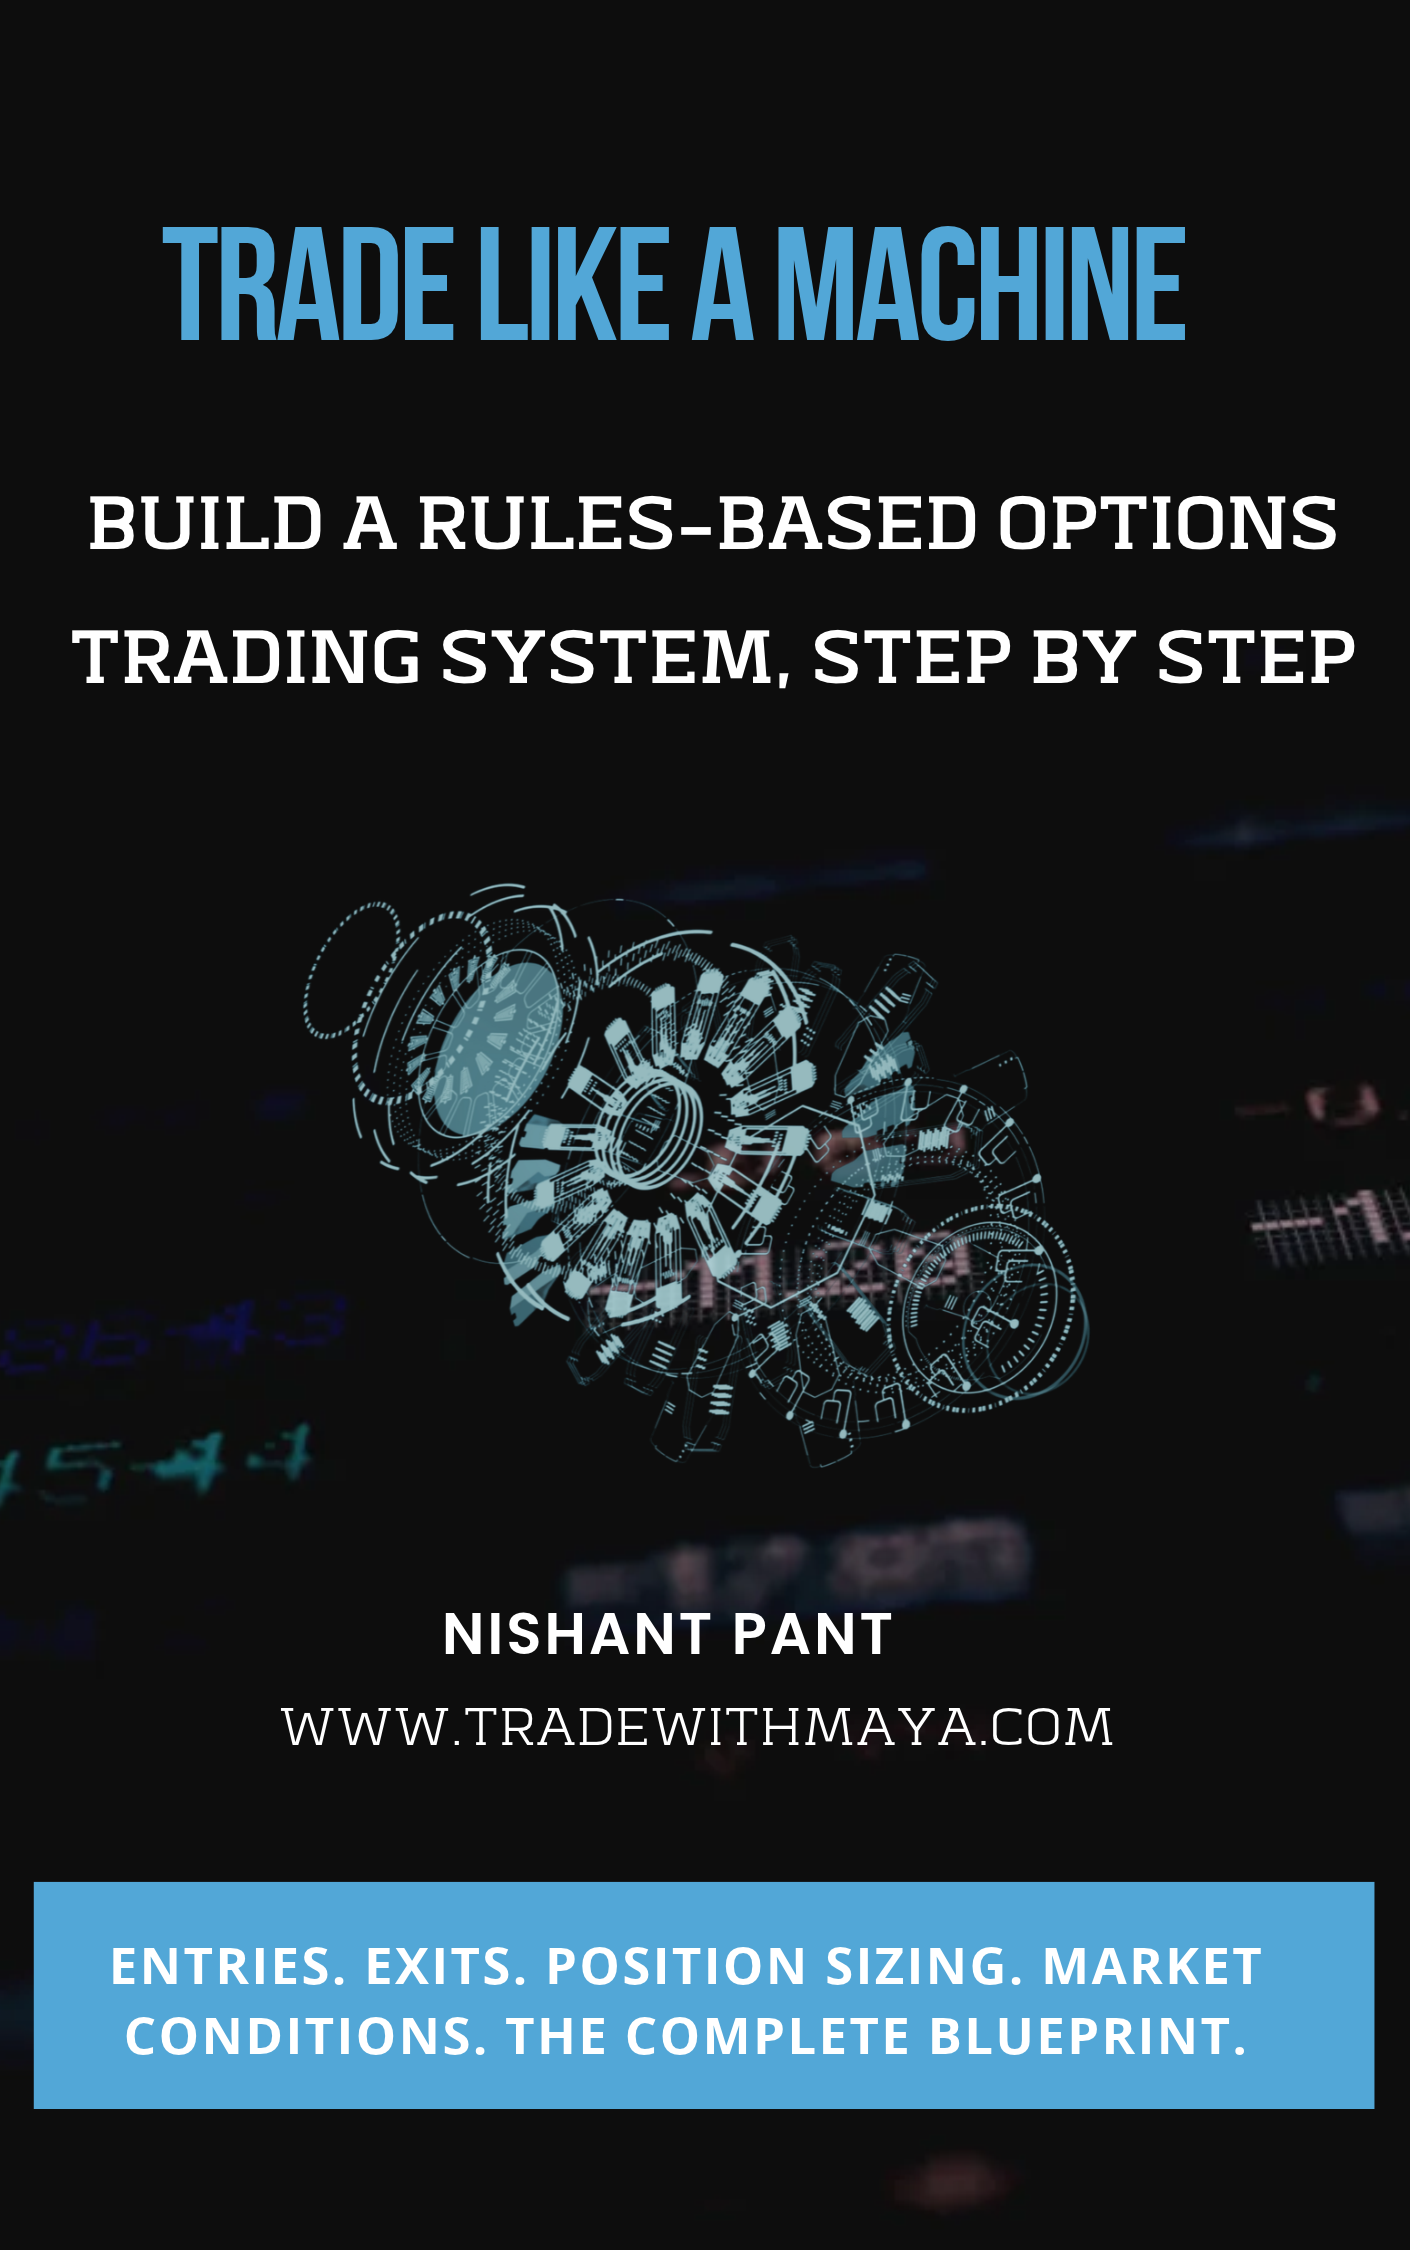
Trade Like a Machine book cover

Why I'm writing it

This is my third book, and it's the one many people have asked me for. For years I've been asked to share what I've learned building a full-blown automated trading system. This is my attempt.

Over the years I've worked with more than six thousand options traders, and the same three problems kept showing up. Most people have a strategy but not a system. Most understand their rules but drop them the moment a trade goes bad. And most spend far more energy trying to win more than trying to lose less.

The book uses real charts and real data instead of hunches, and it's honest about the ideas that didn't work, because those are often the most useful ones.

What's inside

Twenty-two chapters in four parts, plus five appendices, building from the mistake most traders make to a complete, testable system.

Part One. Why You Need a System

Why systems beat gut feel, and why most traders lose even when they are right.

  1. 1
    The Hardest Thing in Trading Isn't Finding a TradeWhy being right about a trade still isn't enough without a system to protect you from yourself.
  2. 2
    Why Most Traders Lose (And It Has Nothing to Do With Bad Luck)Why smart, educated traders still lose, and why intelligence was never the missing piece.
  3. 3
    From Gut Feelings to a Rule Book: My StoryThe author's own story, from chasing tips and hunches to writing down real rules.
  4. 4
    The Difference Between a Strategy and a SystemWhat separates a strategy from a complete, testable trading system.

Part Two. Building the System

The pieces of a complete system, one at a time: what you trade, indicators, reading the market, entries, the trade itself, exits and sizing.

  1. 5
    No Universe, No SystemHow to build and maintain a fixed watchlist of liquid stocks before you trade a single one.
  2. 6
    Indicators as Building Blocks (Not Magic Wands)How to use EMA, MACD, RSI, and other indicators correctly instead of chasing a new one every time one stops working.
  3. 7
    Reading the Market Before You Read a StockWhy checking the overall market comes before checking any stock, including how Maya's own launch handled a crash in its first weeks.
  4. 8
    Entries: Making Every Stock Earn Its Way InThe entry checklist every stock has to pass, gate by gate, before a trade opens.
  5. 9
    Five Decisions, One TradeHow to build the actual options position: strike, expiration, price, and size, decided in advance.
  6. 10
    Winners and Losers Look Identical at the DoorFour real trades, walked through step by step, including one that did everything right and still lost.
  7. 11
    Exits: Deciding Before You EnterWhy exits have to be decided before a trade opens, and what the backtest says each one is actually worth.
  8. 12
    Sizing Without Blowing UpHow much to risk per trade, why correlated losses cluster together, and where the Kelly criterion breaks down.

Part Three. Proving It

How to test your own rules in a spreadsheet, and what the real results show.

  1. 13
    Backtesting Without a PhDHow to build a real backtest in a spreadsheet, no coding required.
  2. 14
    What the Backtests Actually ShowAn honest read of seven years and 2,361 trades, including the losing year and the losing streaks.

Part Four. Running It

Going live, why a signal is not a system, getting back in after a bad stretch, judging results like a professional, stress-testing against history it never saw, a hands-on workbook, running the rules without code, and staying consistent.

  1. 15
    Before You Go Live: A Pre-Launch ChecklistSharpe ratio, drawdown, and the honest question of whether you can survive the ride before you trade it live.
  2. 16
    A Signal Is Not a SystemWhy a chart alert is a good front door but not a finished trading system on its own.
  3. 17
    After the Crash, the Harder TradeWhen it's actually safe to start trading again after a crash, using Maya's real April 2025 restart as the example.
  4. 18
    What the Return Number Doesn't Tell YouProfit factor and expectancy: why a headline win rate can hide a losing system.
  5. 19
    Ten Thousand Alternate TimelinesSimulating thousands of alternate market histories to see how much of a good result was just luck.
  6. 20
    The WorkbookA hands-on workbook to build and test your own version of the system.
  7. 21
    You Don't Need to Code to Run ThisRunning the whole system by hand with a brokerage account, a spreadsheet, and a notebook.
  8. 22
    The Real Edge: Consistency Over TimeWhat it actually costs to follow the rules on the week they're hardest to follow.

Appendices

The system on one page, what AI can do for a trader now, frequently asked questions, resources and a glossary.

  1. A
    The Complete System at a GlanceThe entire system condensed to a few pages, in the order a trading day runs.
  2. B
    What AI Can Do for a Trader NowWhat today's AI tools can and can't do for a trader, broker by broker.
  3. C
    Frequently Asked QuestionsStraight answers to the questions readers ask most.
  4. D
    Resources and Further ReadingA short list of real books and tools worth your time.
  5. E
    Glossary of TermsEvery term used in the book, defined in plain language.

Real charts, real data

Every chart in the book is drawn from real market data, including the ones that don't flatter the idea. Here are two of them.
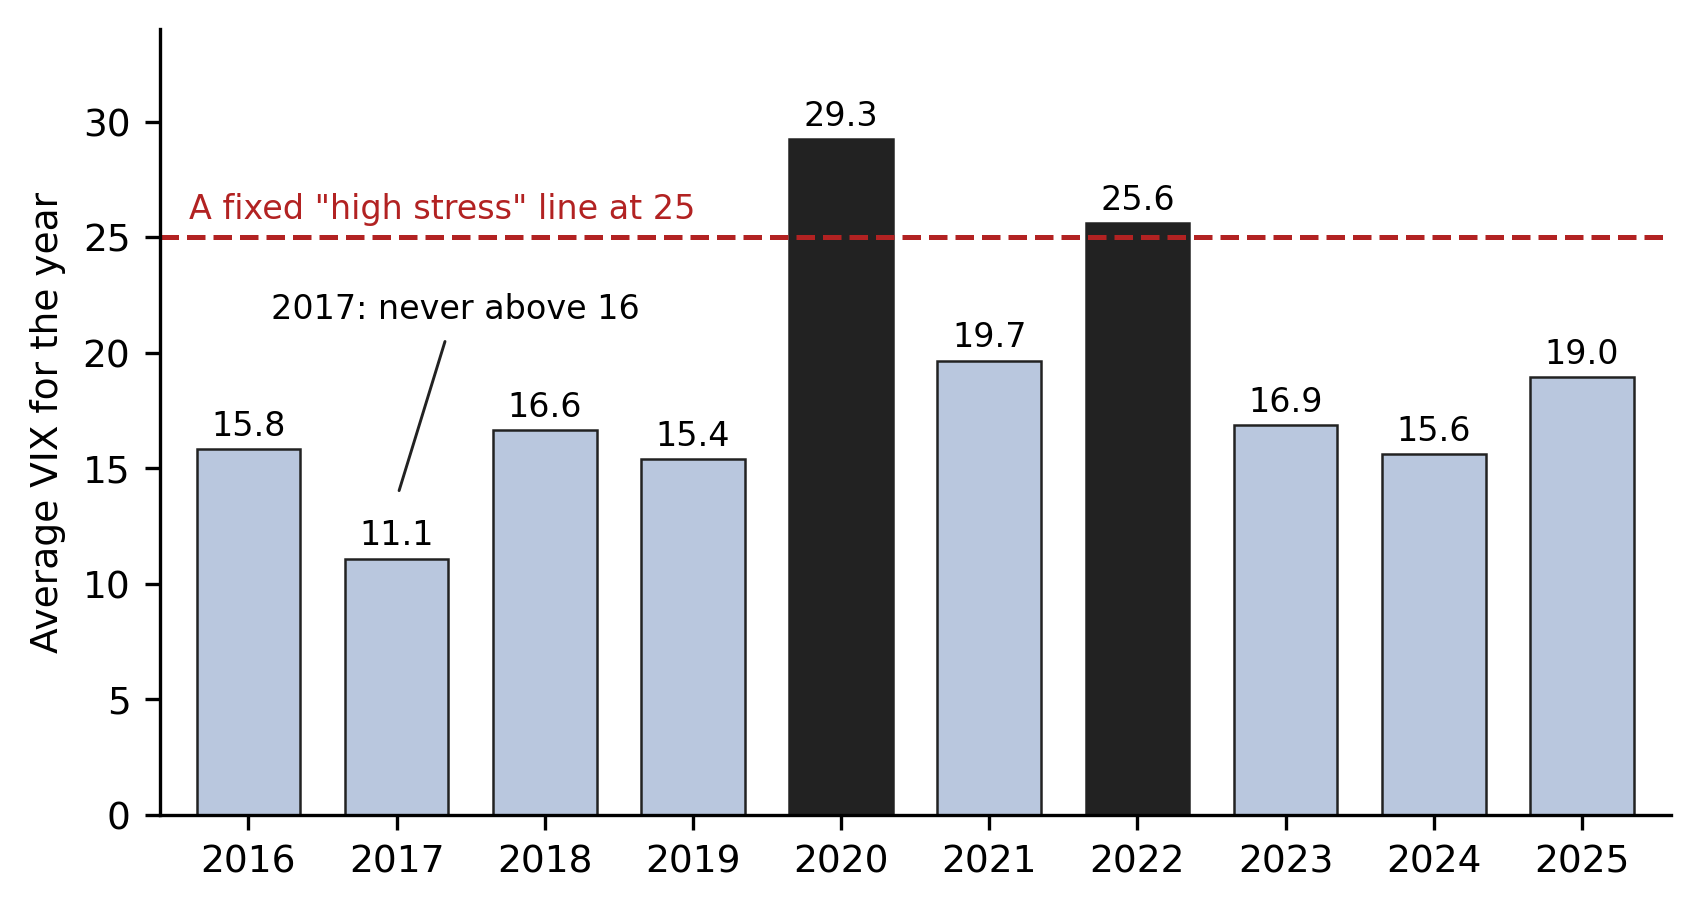
Bar chart of the average VIX by year from 2016 to 2025 with a fixed high-stress line at 25
Why a fixed number misleads. A VIX of 25 meant panic in 2017 and a normal day in 2022.
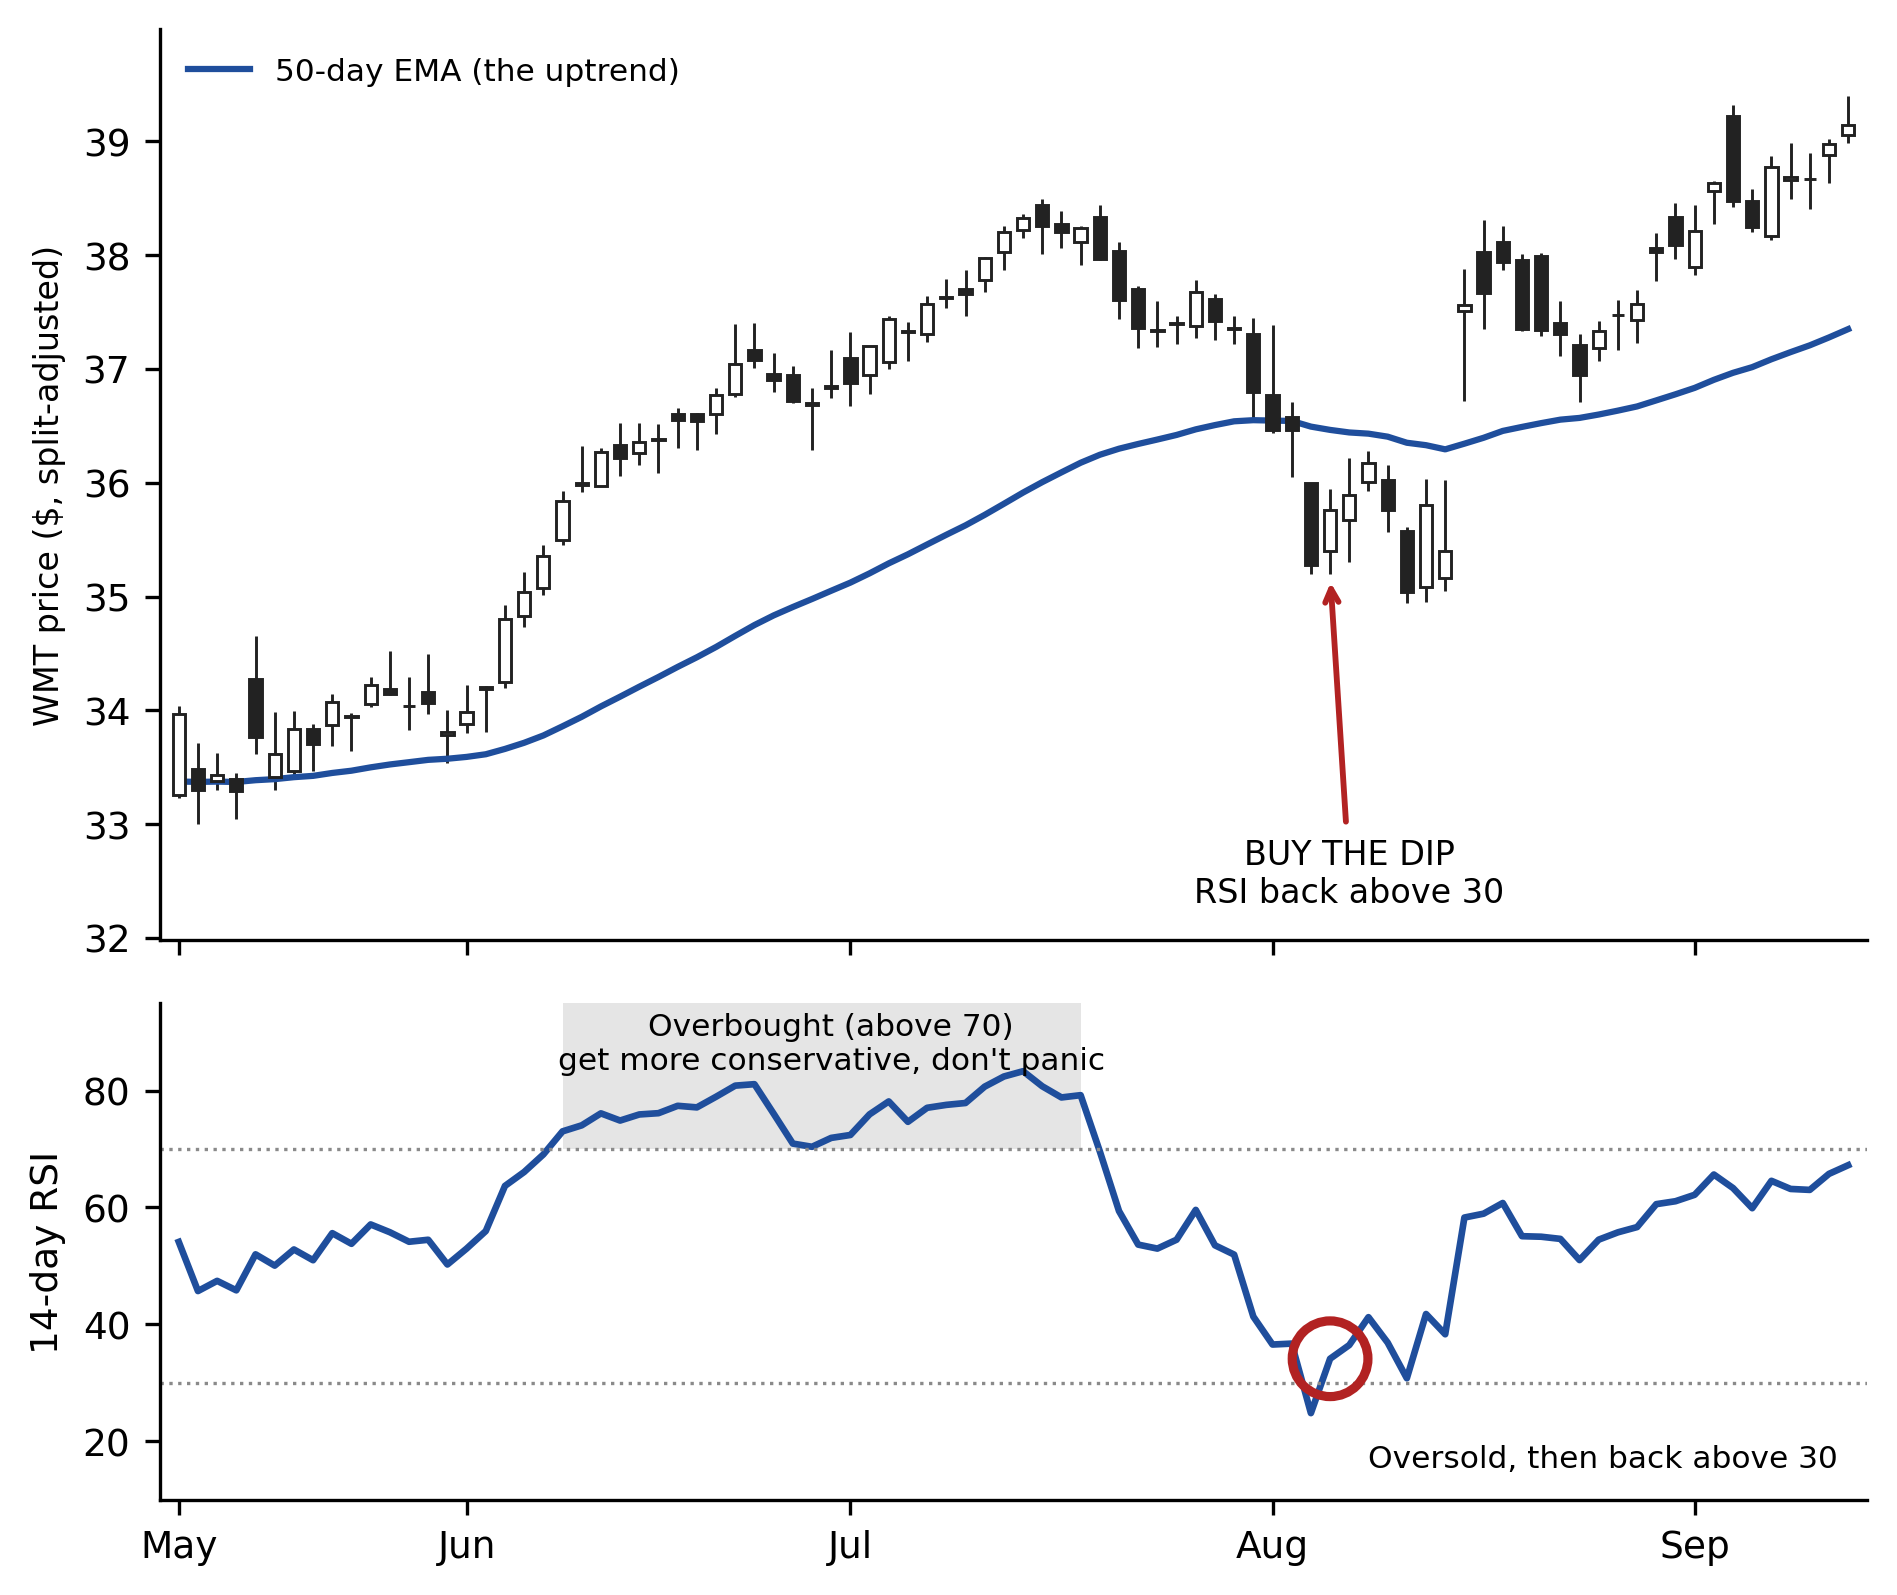
Candlestick chart with RSI showing an overbought stretch and a later oversold bounce back above 30
Overbought means get careful, not panic. A dip below 30 inside an uptrend can be an entry. One example, not a recommendation.

Full-color images from the book

The printed book is black and white. Here is every chart, diagram and screenshot in full color and full size, grouped by chapter. Click any image to open it, or download it. Reading on a Kindle app, a Fire tablet or read.amazon.com? Those show the images in color too, though an e-ink Kindle shows gray. Looking for the code? Jump to the code samples.

Chapter 1: The Hardest Thing in Trading Isn't Finding a TradeBack to top
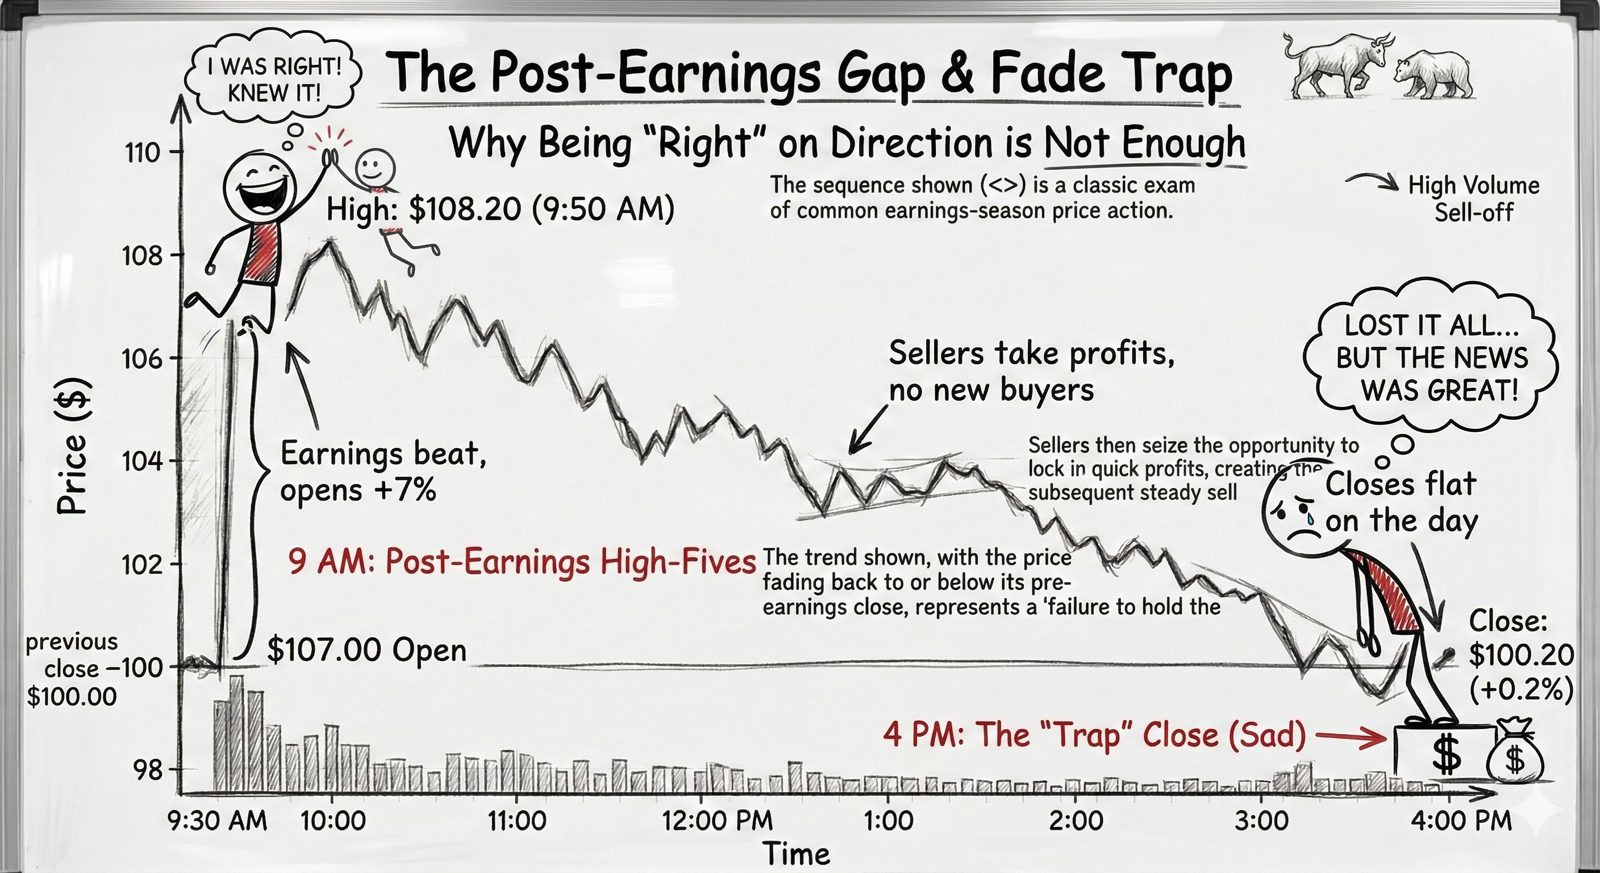
A whiteboard-style breakdown of the post-earnings gap and fade: the stock opens up 7% on an earnings beat, traders high-five the gap, then sellers quietly take profits and the stock grinds back...
A whiteboard-style breakdown of the post-earnings gap and fade: the stock opens up 7% on an earnings beat, traders high-five the gap, then sellers quietly take profits and the stock grinds back... Download full size
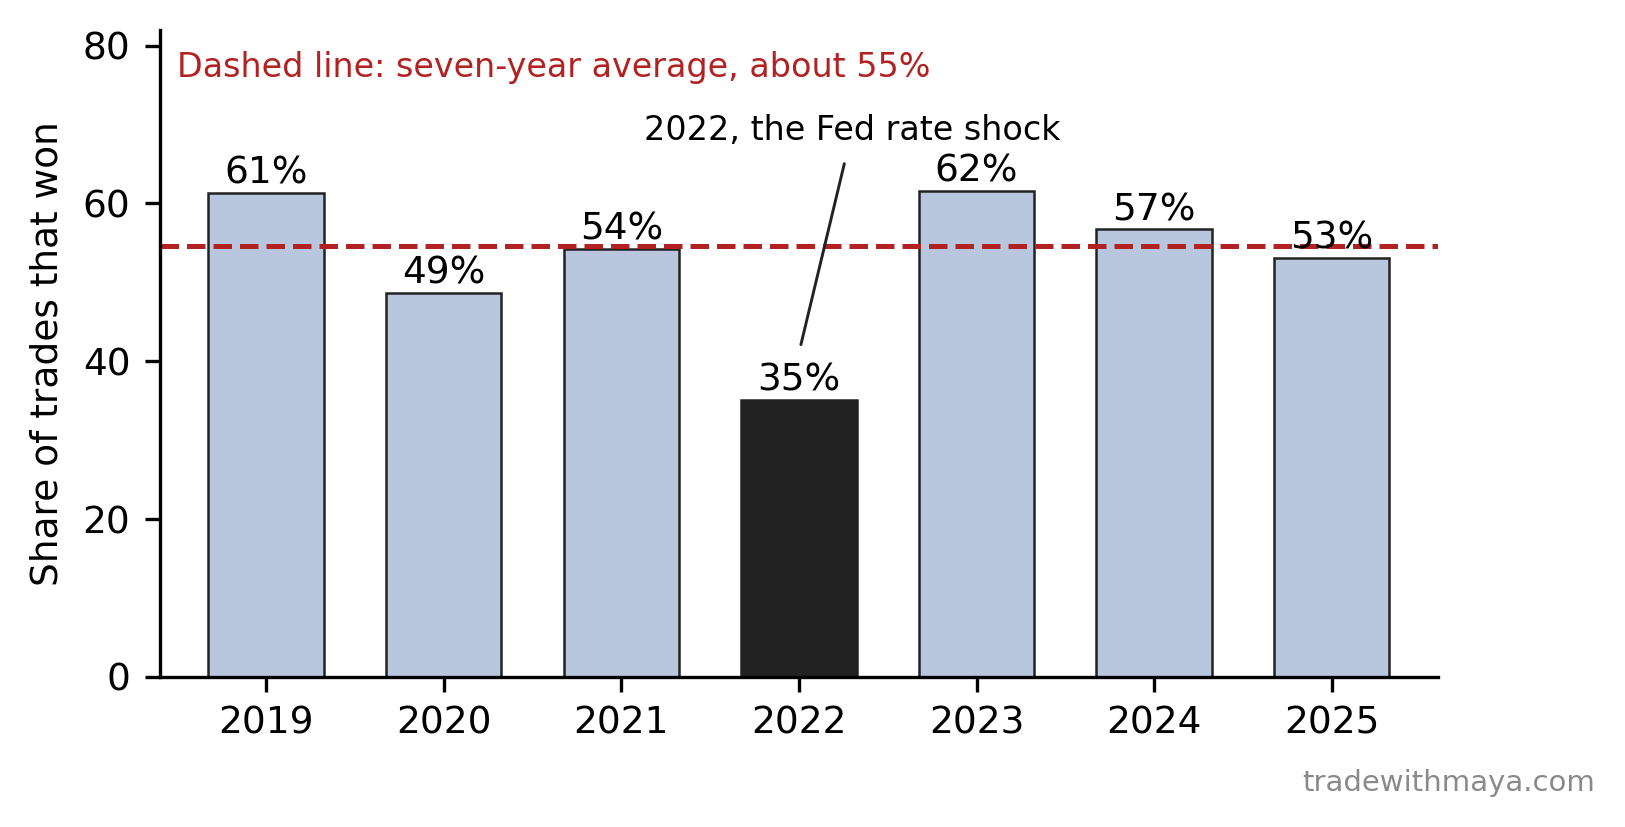
Maya's backtested win rate by year, 2019 through 2025.
Maya's backtested win rate by year, 2019 through 2025. Download full size
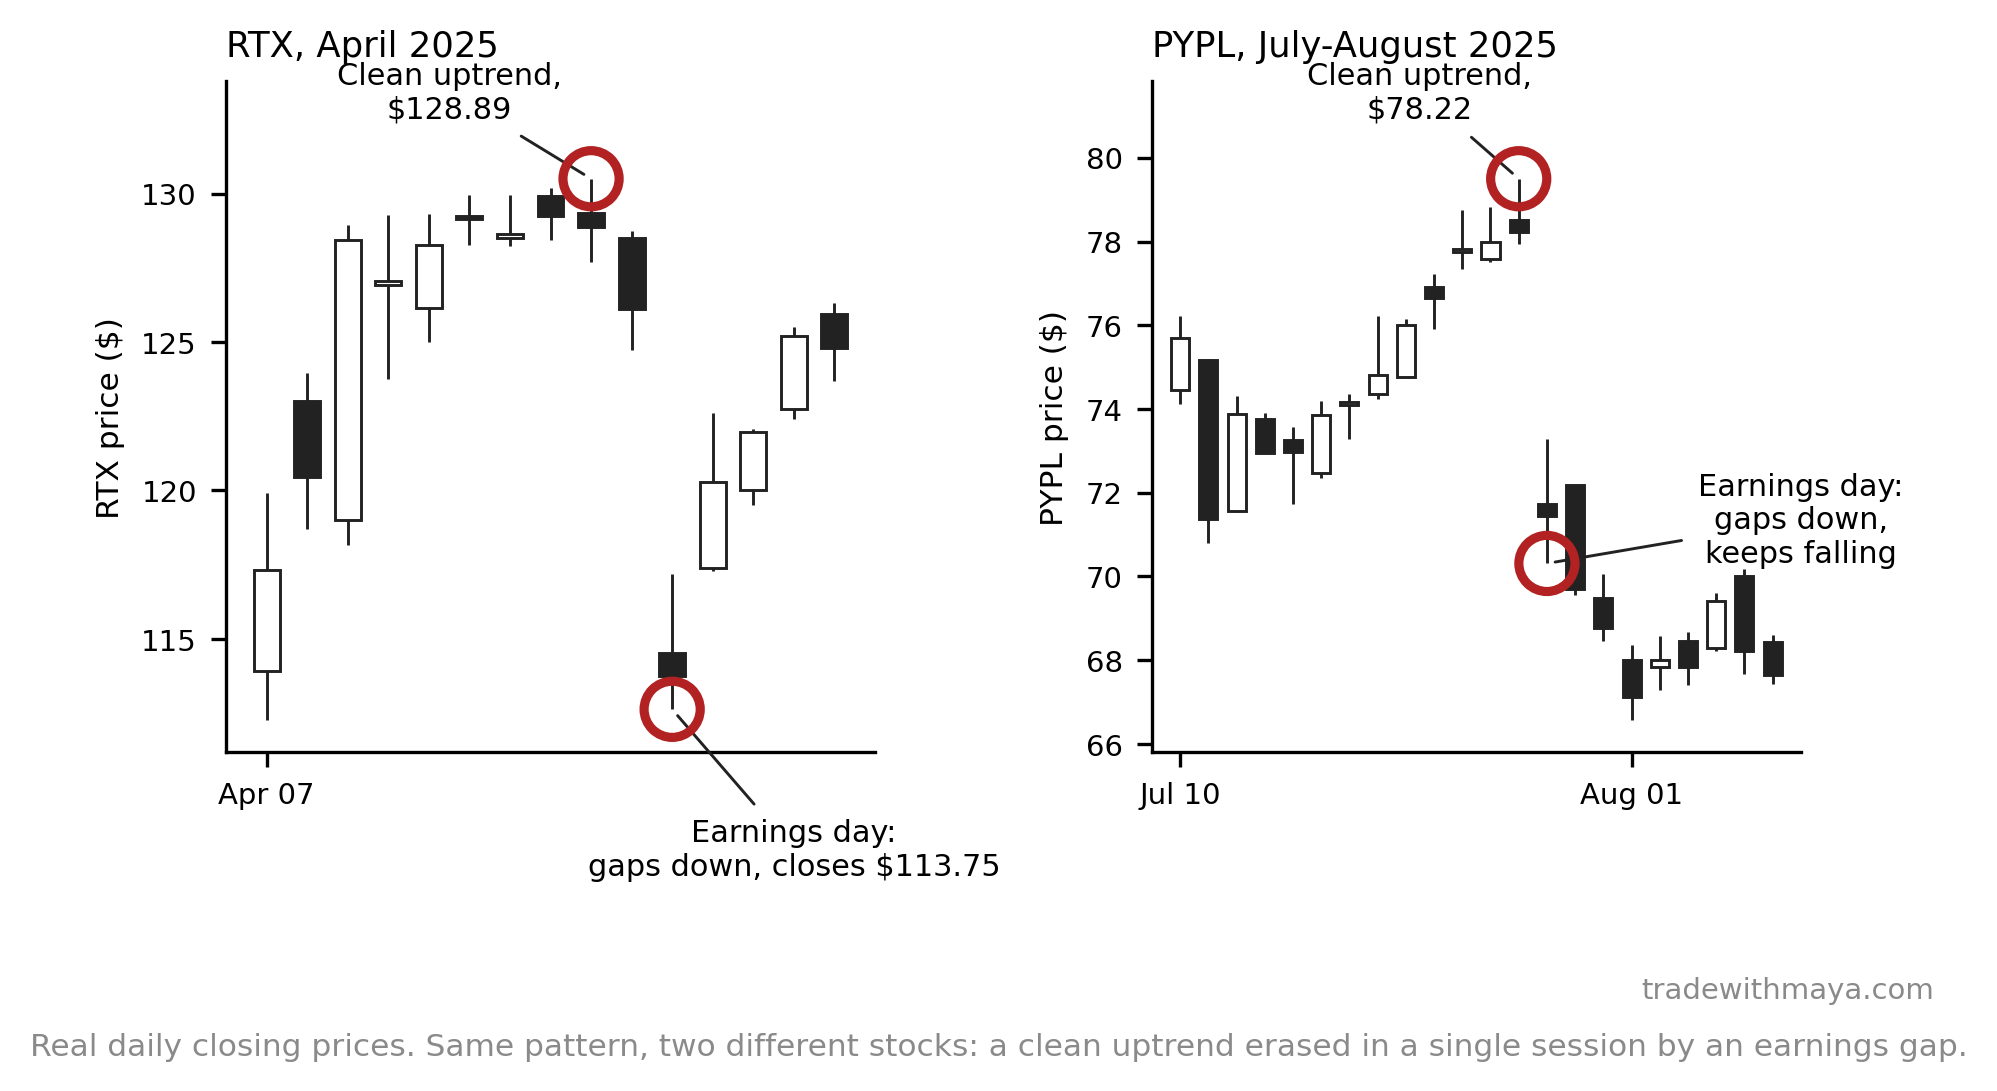
RTX in April 2025 and PYPL that July, real daily closing prices.
RTX in April 2025 and PYPL that July, real daily closing prices. Download full size
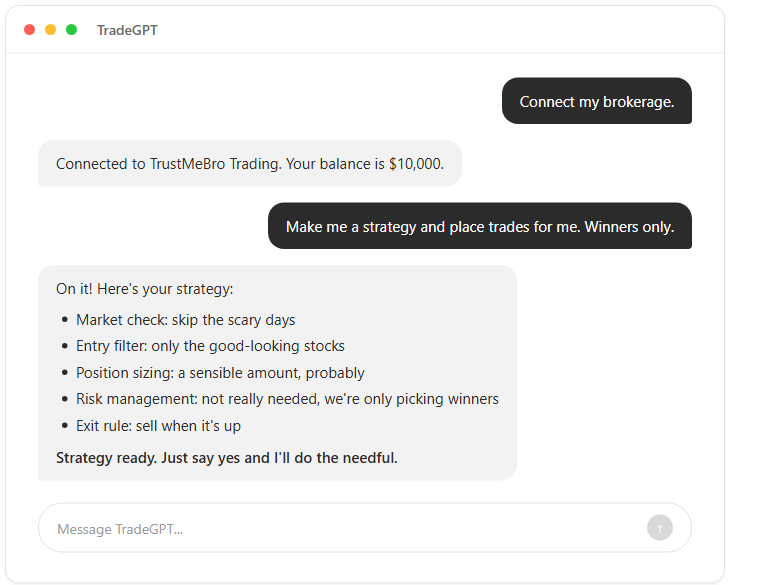
A chat with an AI tool called TradeGPT: connect my brokerage, make me a strategy, place trades for me, winners only.
A chat with an AI tool called TradeGPT: connect my brokerage, make me a strategy, place trades for me, winners only. Download full size

Chapter 3: From Gut Feelings to a Rule Book: My StoryBack to top
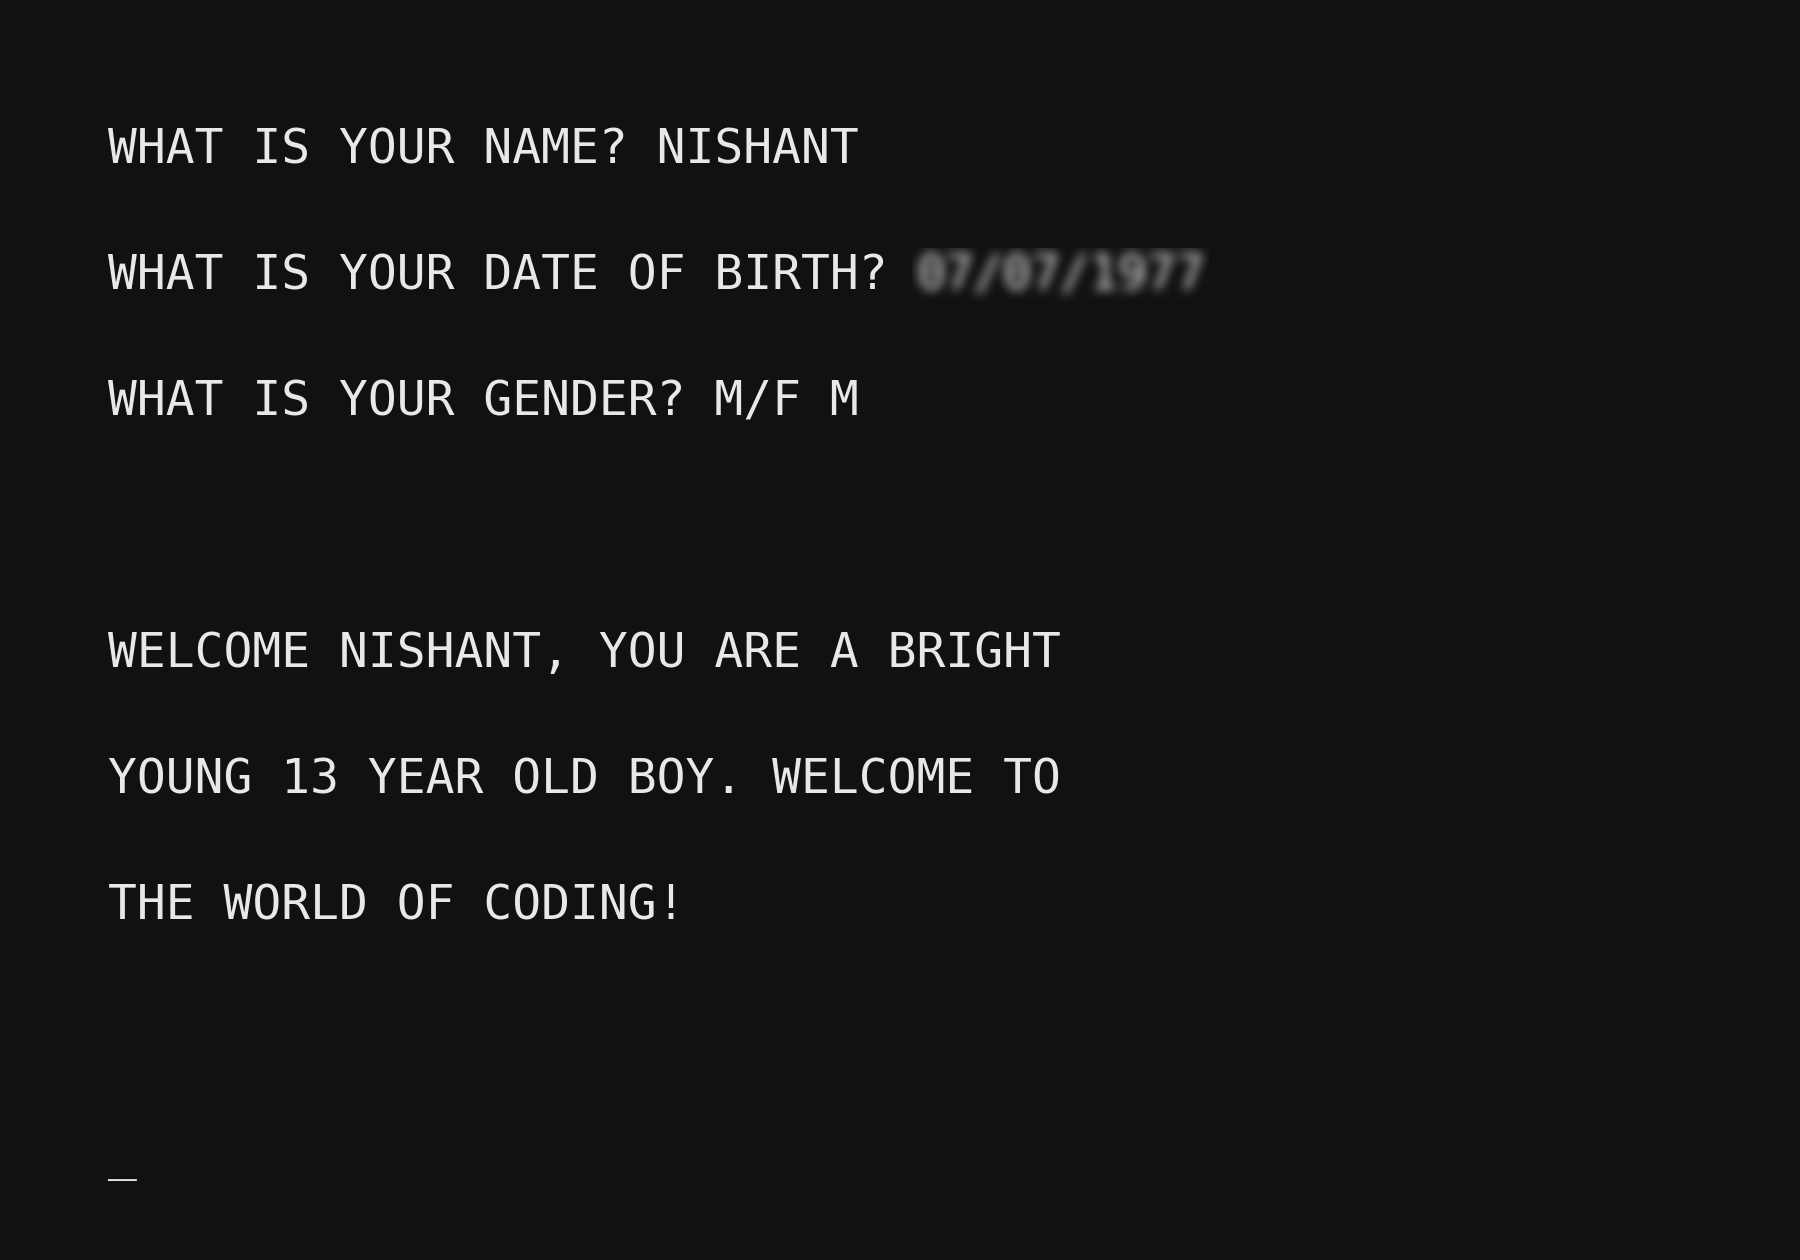
A simulated recreation of the first program the author ever wrote, on a 1980s mainframe terminal.
A simulated recreation of the first program the author ever wrote, on a 1980s mainframe terminal. Download full size
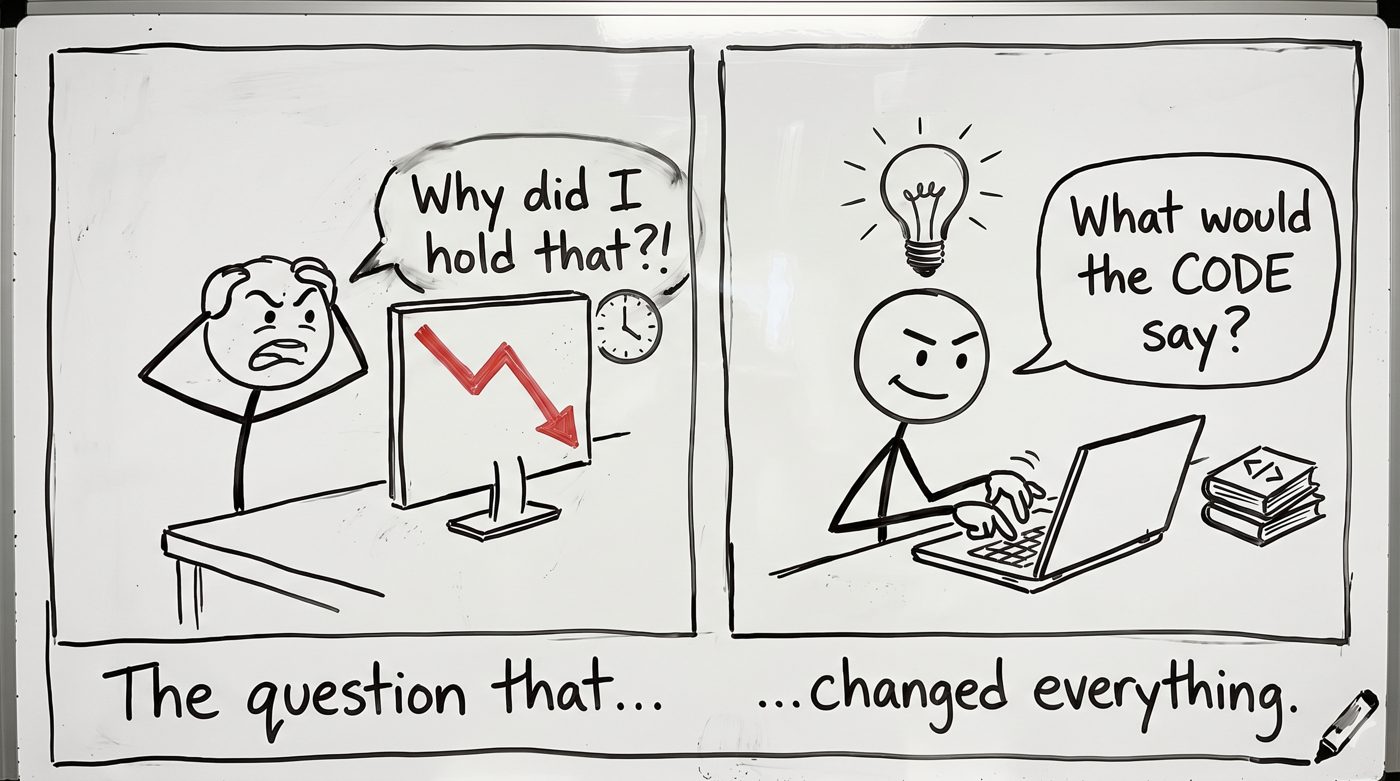
A hand-drawn two-panel whiteboard sketch.
A hand-drawn two-panel whiteboard sketch. Download full size

Chapter 4: The Difference Between a Strategy and a SystemBack to top
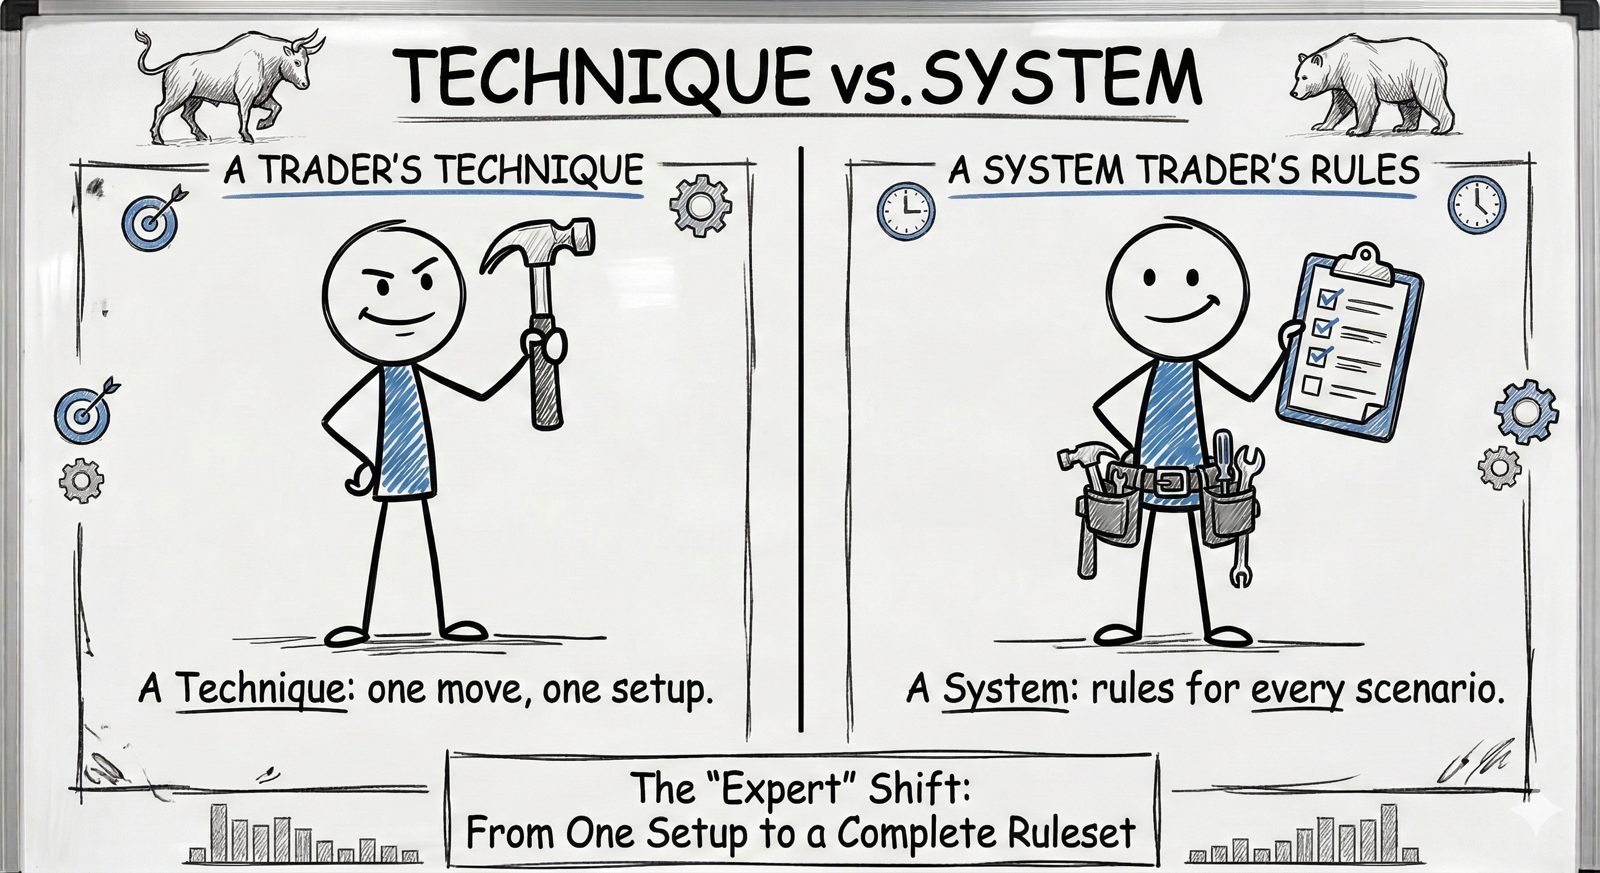
A whiteboard comparison of a trader's technique against a system trader's rules: one stick figure holding a single hammer, labeled "A Technique: one move, one setup," next to another holding a...
A whiteboard comparison of a trader's technique against a system trader's rules: one stick figure holding a single hammer, labeled "A Technique: one move, one setup," next to another holding a... Download full size
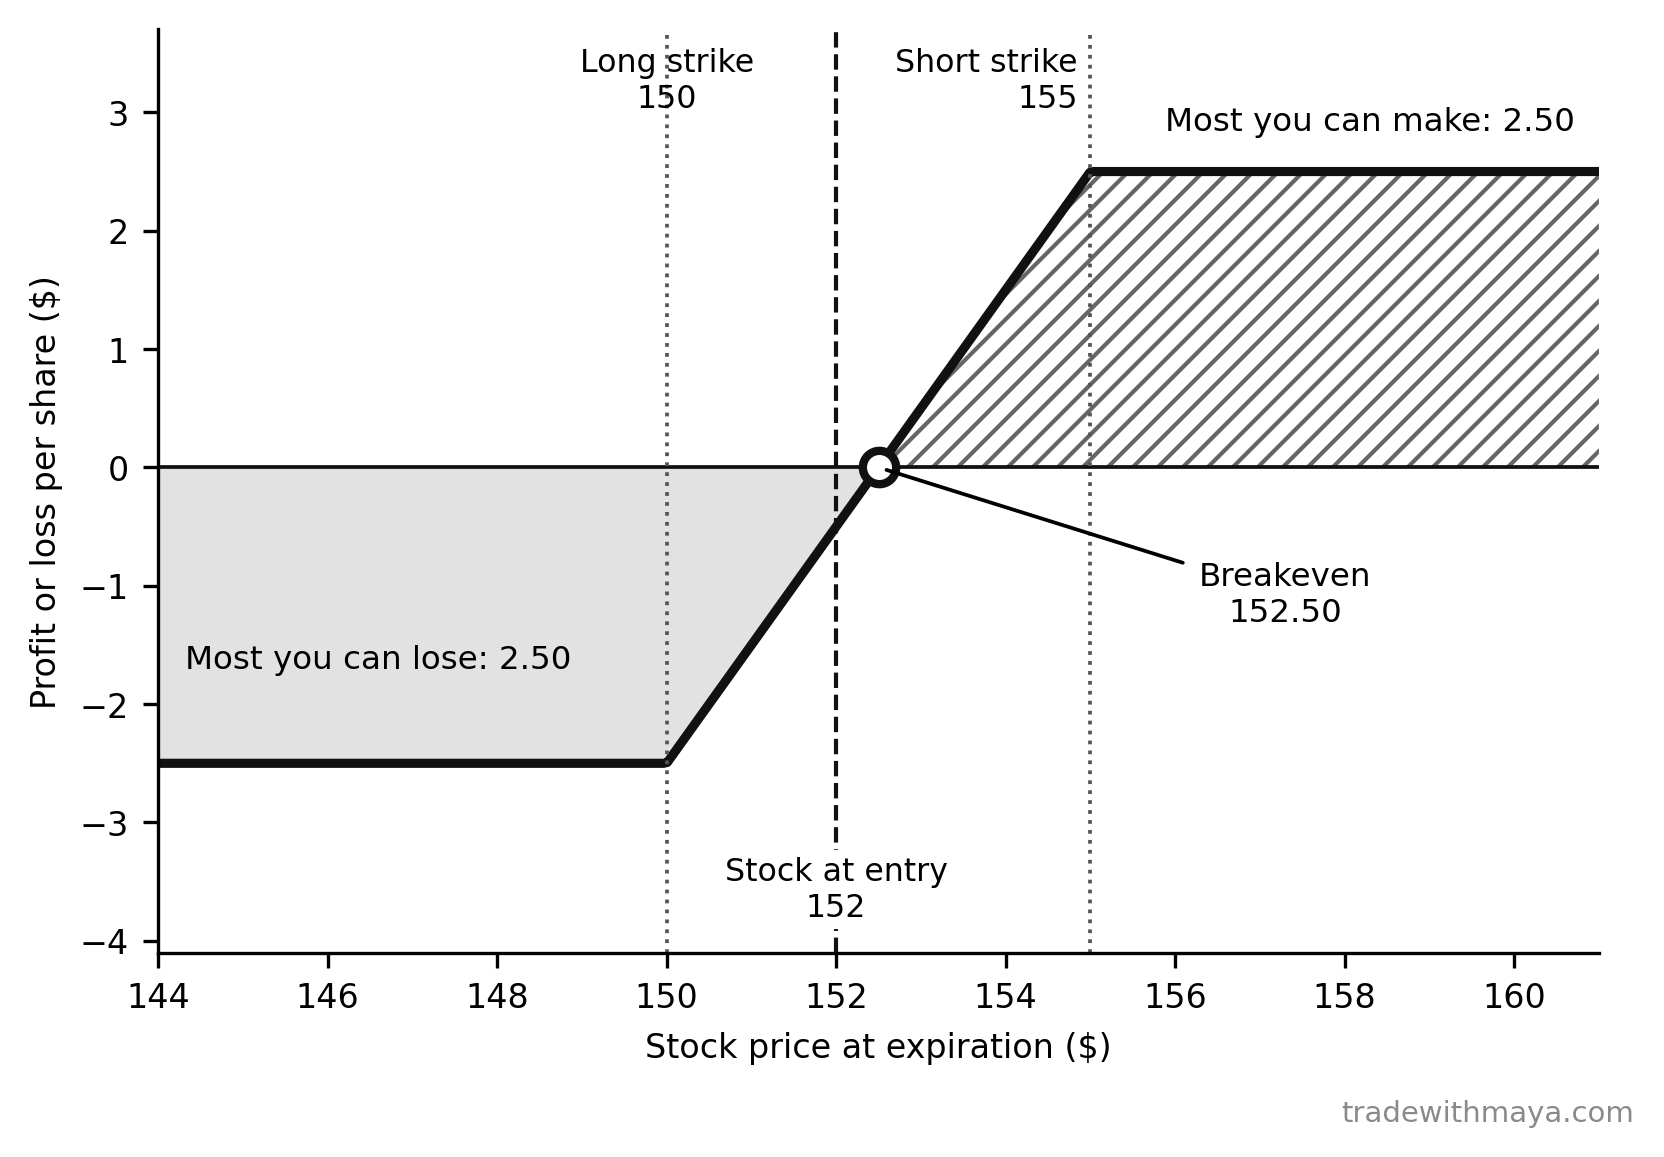
A bull call debit spread's profit and loss at expiration.
A bull call debit spread's profit and loss at expiration. Download full size
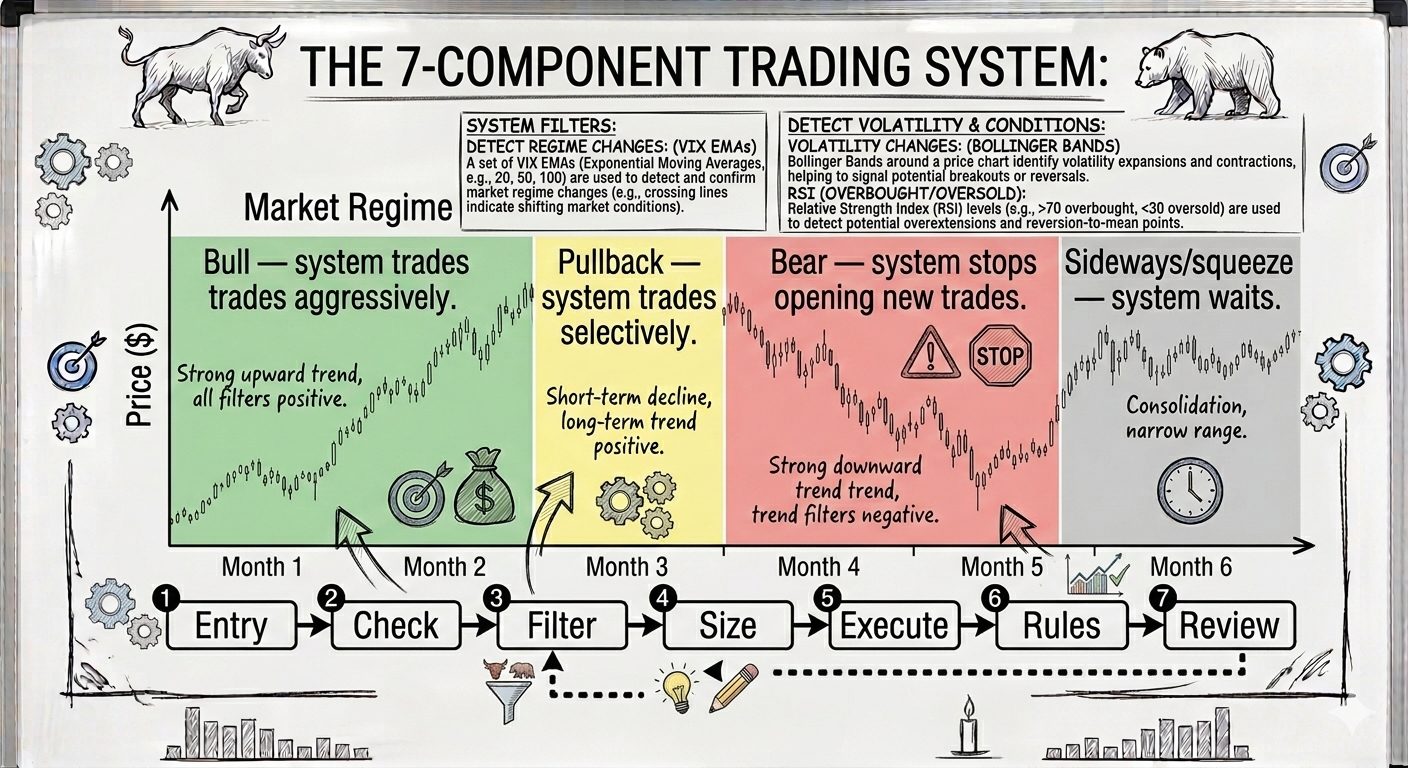
A whiteboard diagram of the seven-component trading system across a six-month price chart: the market regime shifts from Bull (trades aggressively) to Pullback (trades selectively) to Bear (stops...
A whiteboard diagram of the seven-component trading system across a six-month price chart: the market regime shifts from Bull (trades aggressively) to Pullback (trades selectively) to Bear (stops... Download full size

Chapter 5: No Universe, No SystemBack to top
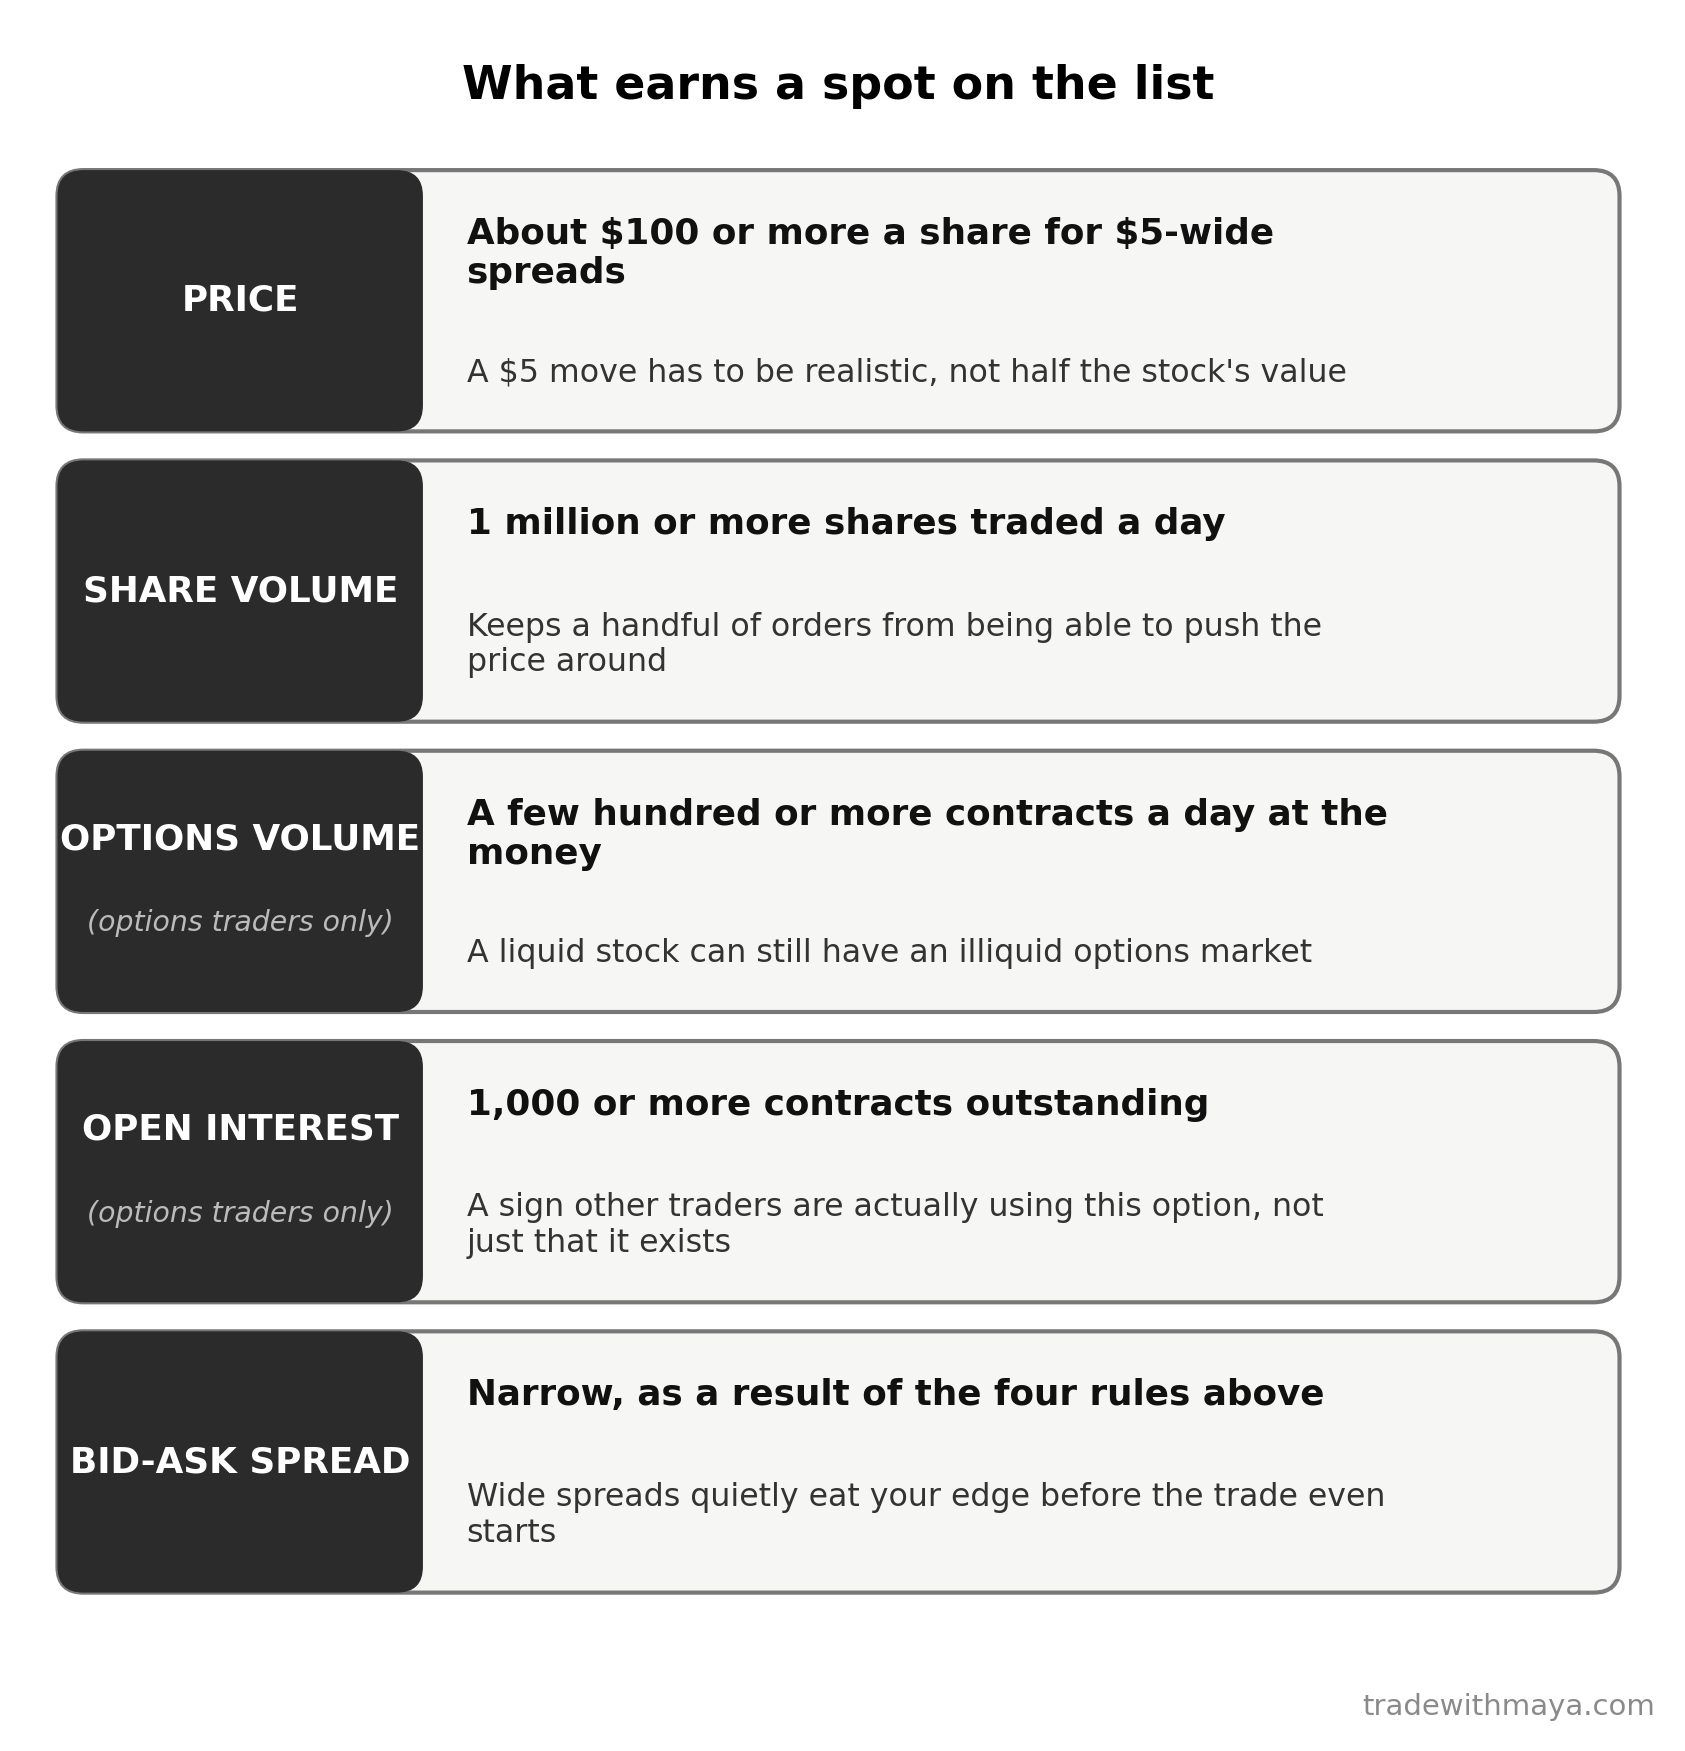
The five liquidity rules a stock has to clear before it's even considered a candidate, each with the reason behind it.
The five liquidity rules a stock has to clear before it's even considered a candidate, each with the reason behind it. Download full size
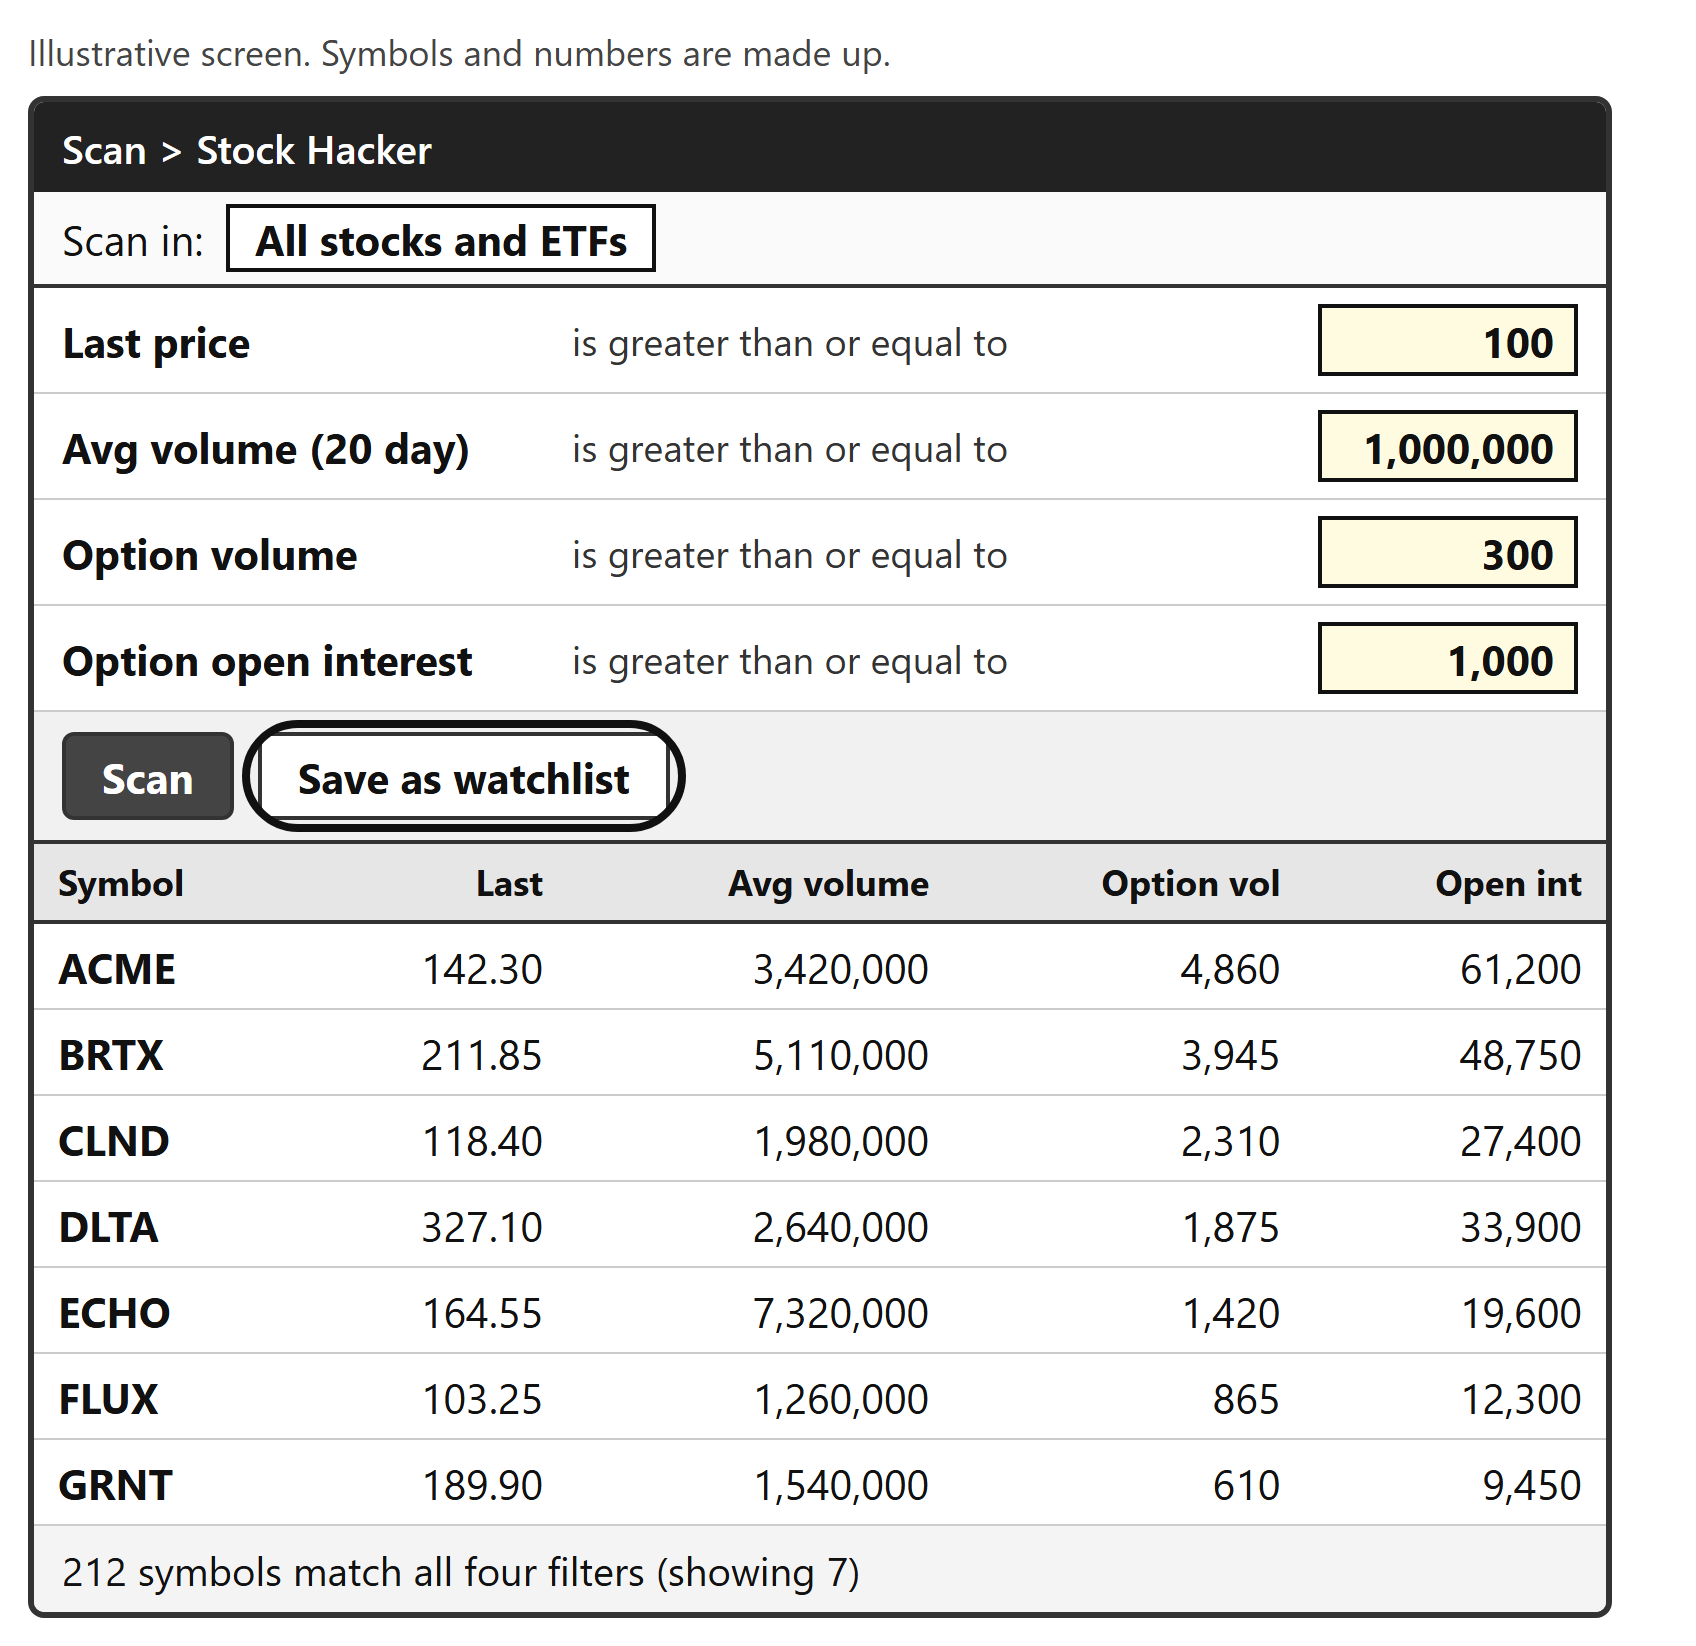
A simulated Stock Hacker scan with four filters (last price at least 100, average volume at least 1,000,000, option volume at least 300, option open interest at least 1,000), a Scan button, a...
A simulated Stock Hacker scan with four filters (last price at least 100, average volume at least 1,000,000, option volume at least 300, option open interest at least 1,000), a Scan button, a... Download full size

Chapter 6: Indicators as Building Blocks (Not Magic Wands)Back to top
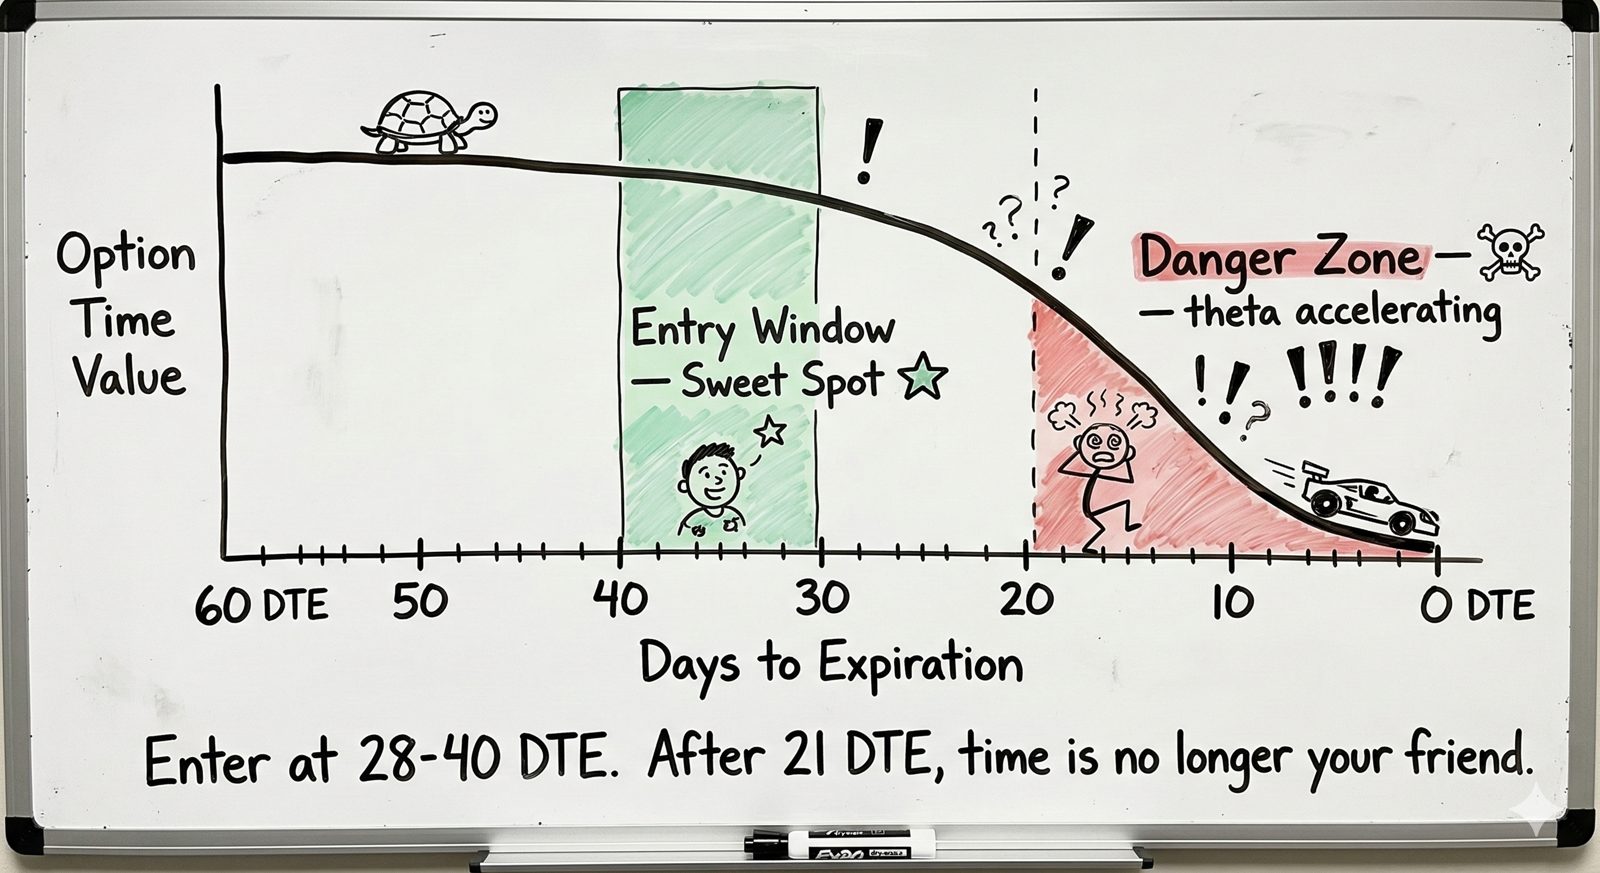
A whiteboard chart of option time value against days to expiration.
A whiteboard chart of option time value against days to expiration. Download full size
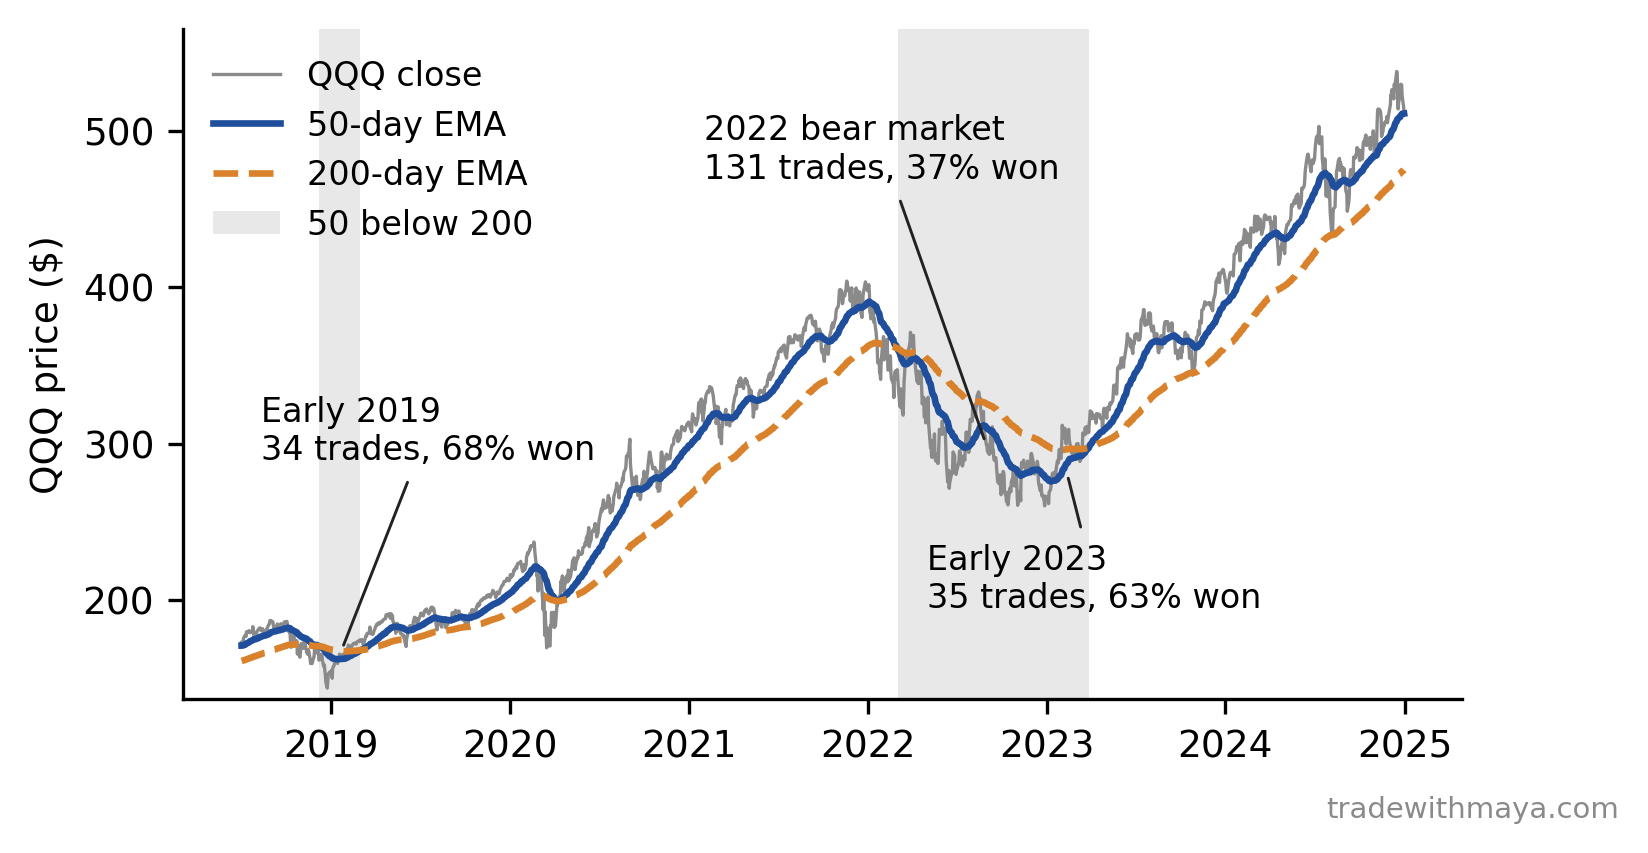
QQQ with its 50-day EMA and 200-day EMA.
QQQ with its 50-day EMA and 200-day EMA. Download full size
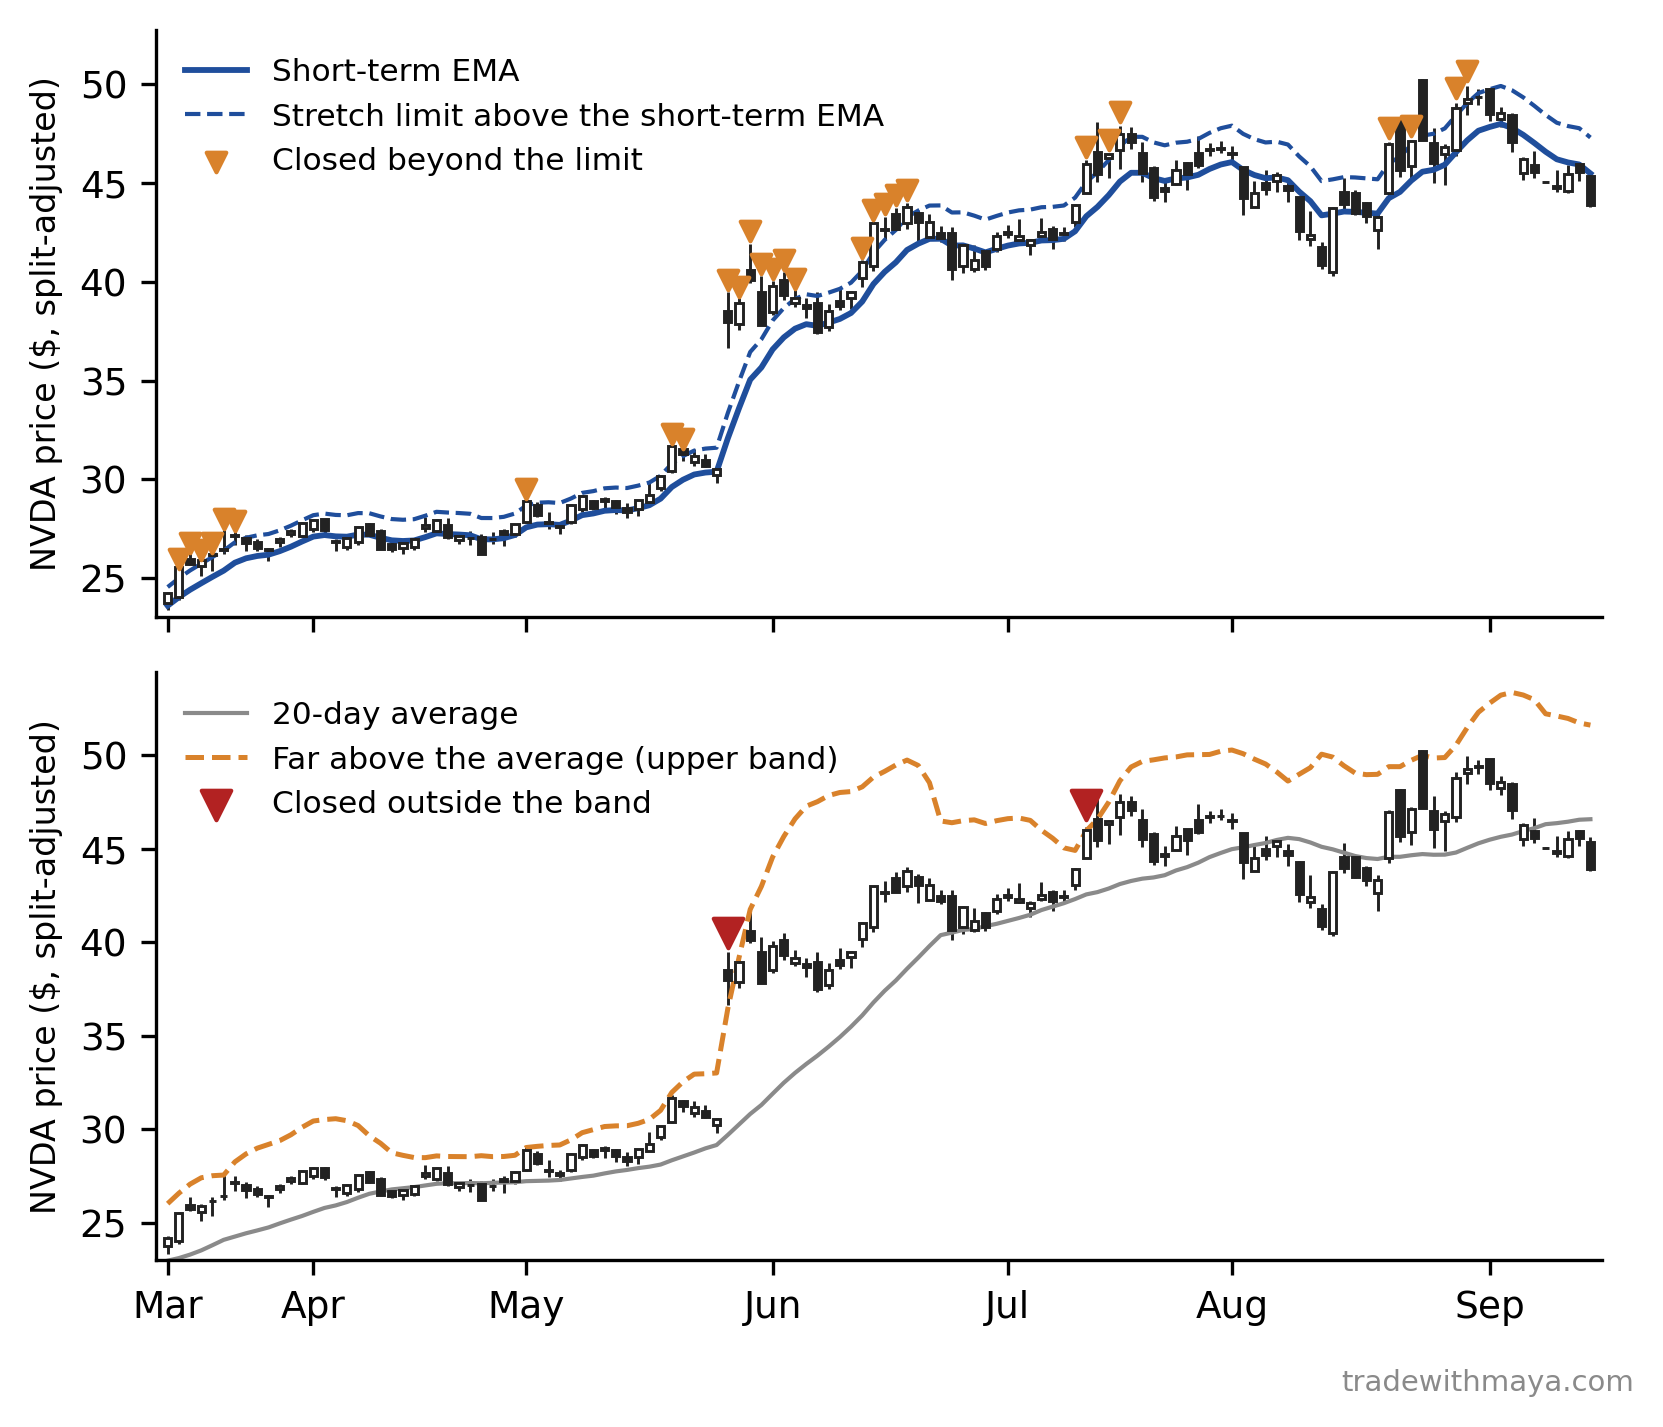
NVDA in 2023.
NVDA in 2023. Download full size
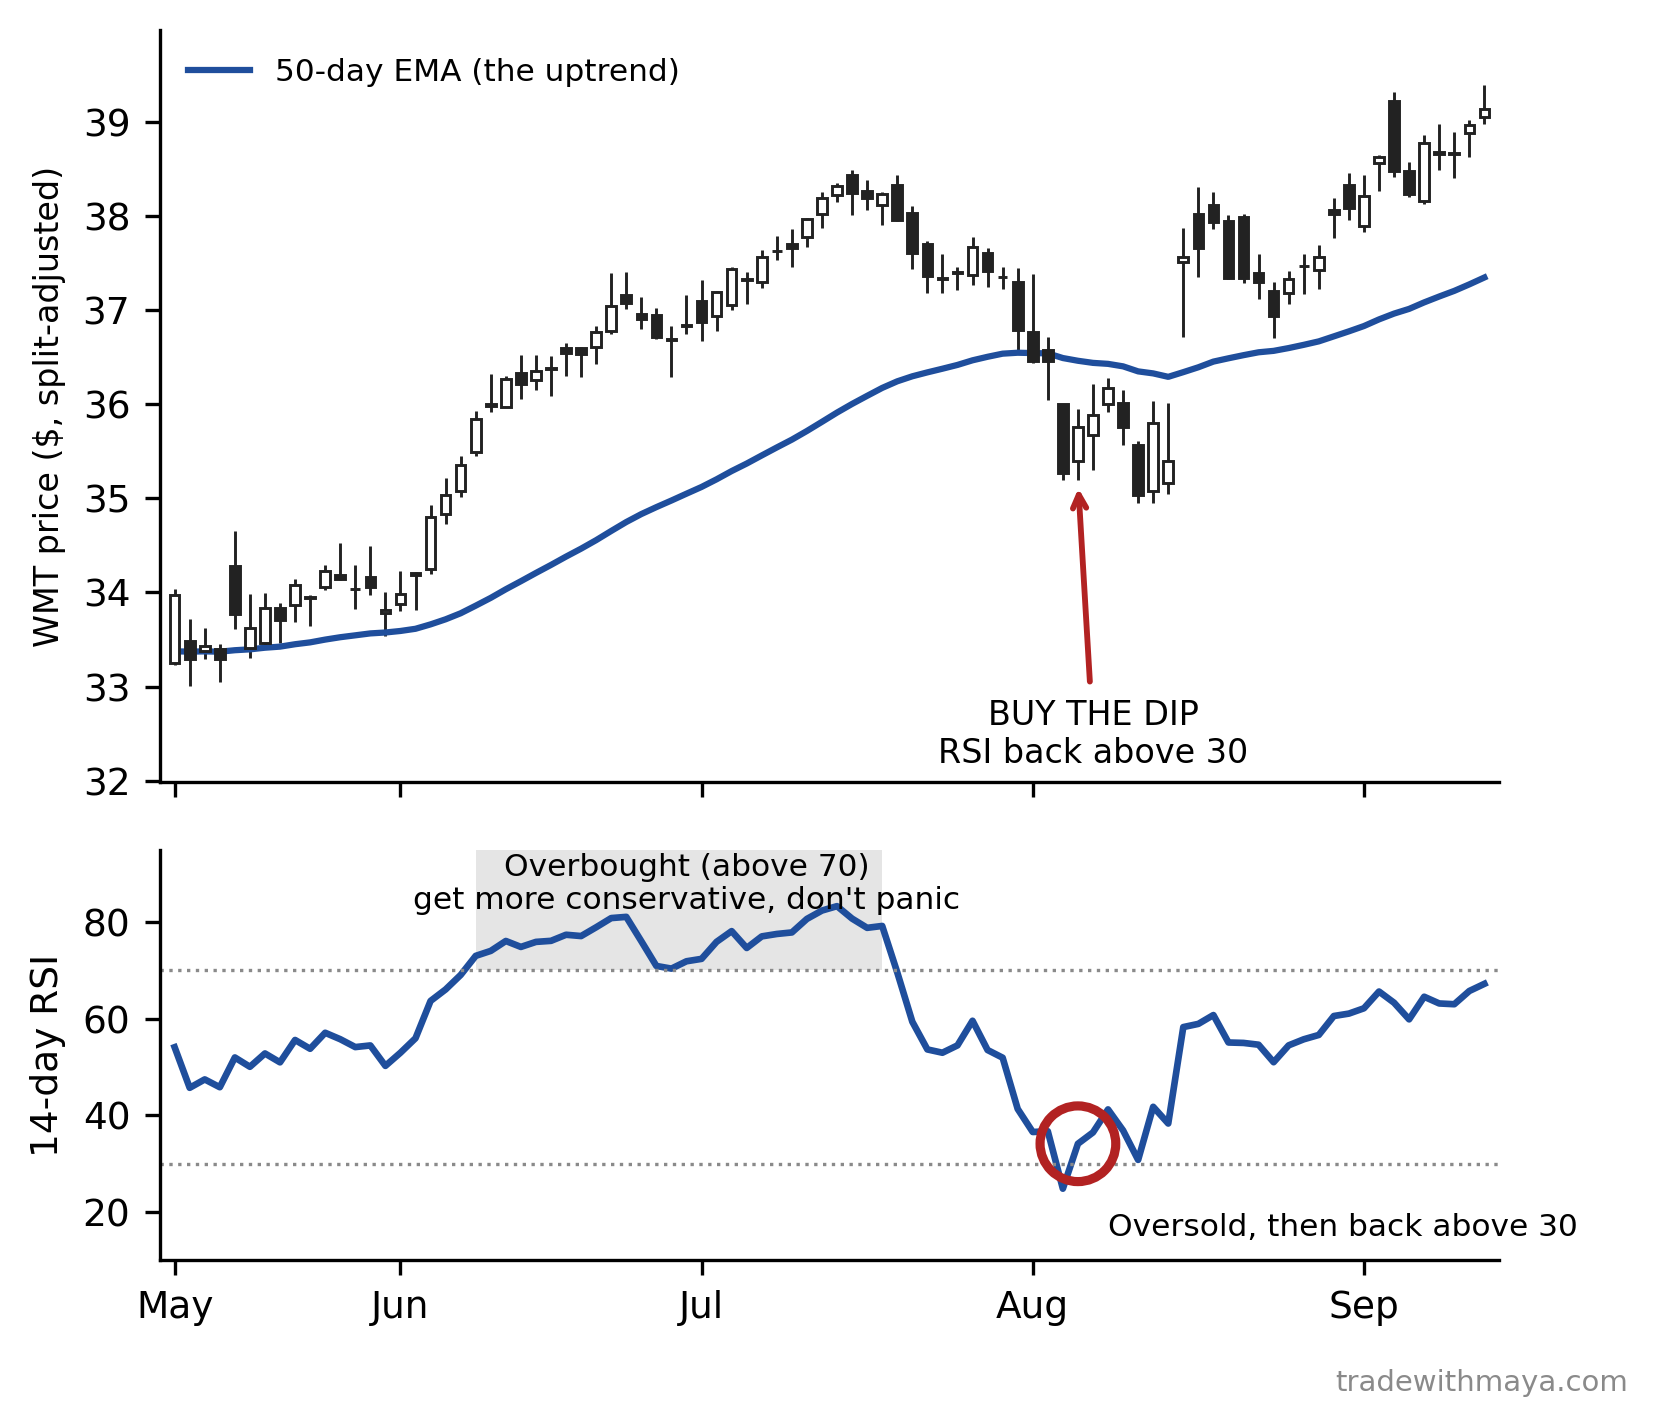
WMT in 2019, using split-adjusted prices.
WMT in 2019, using split-adjusted prices. Download full size
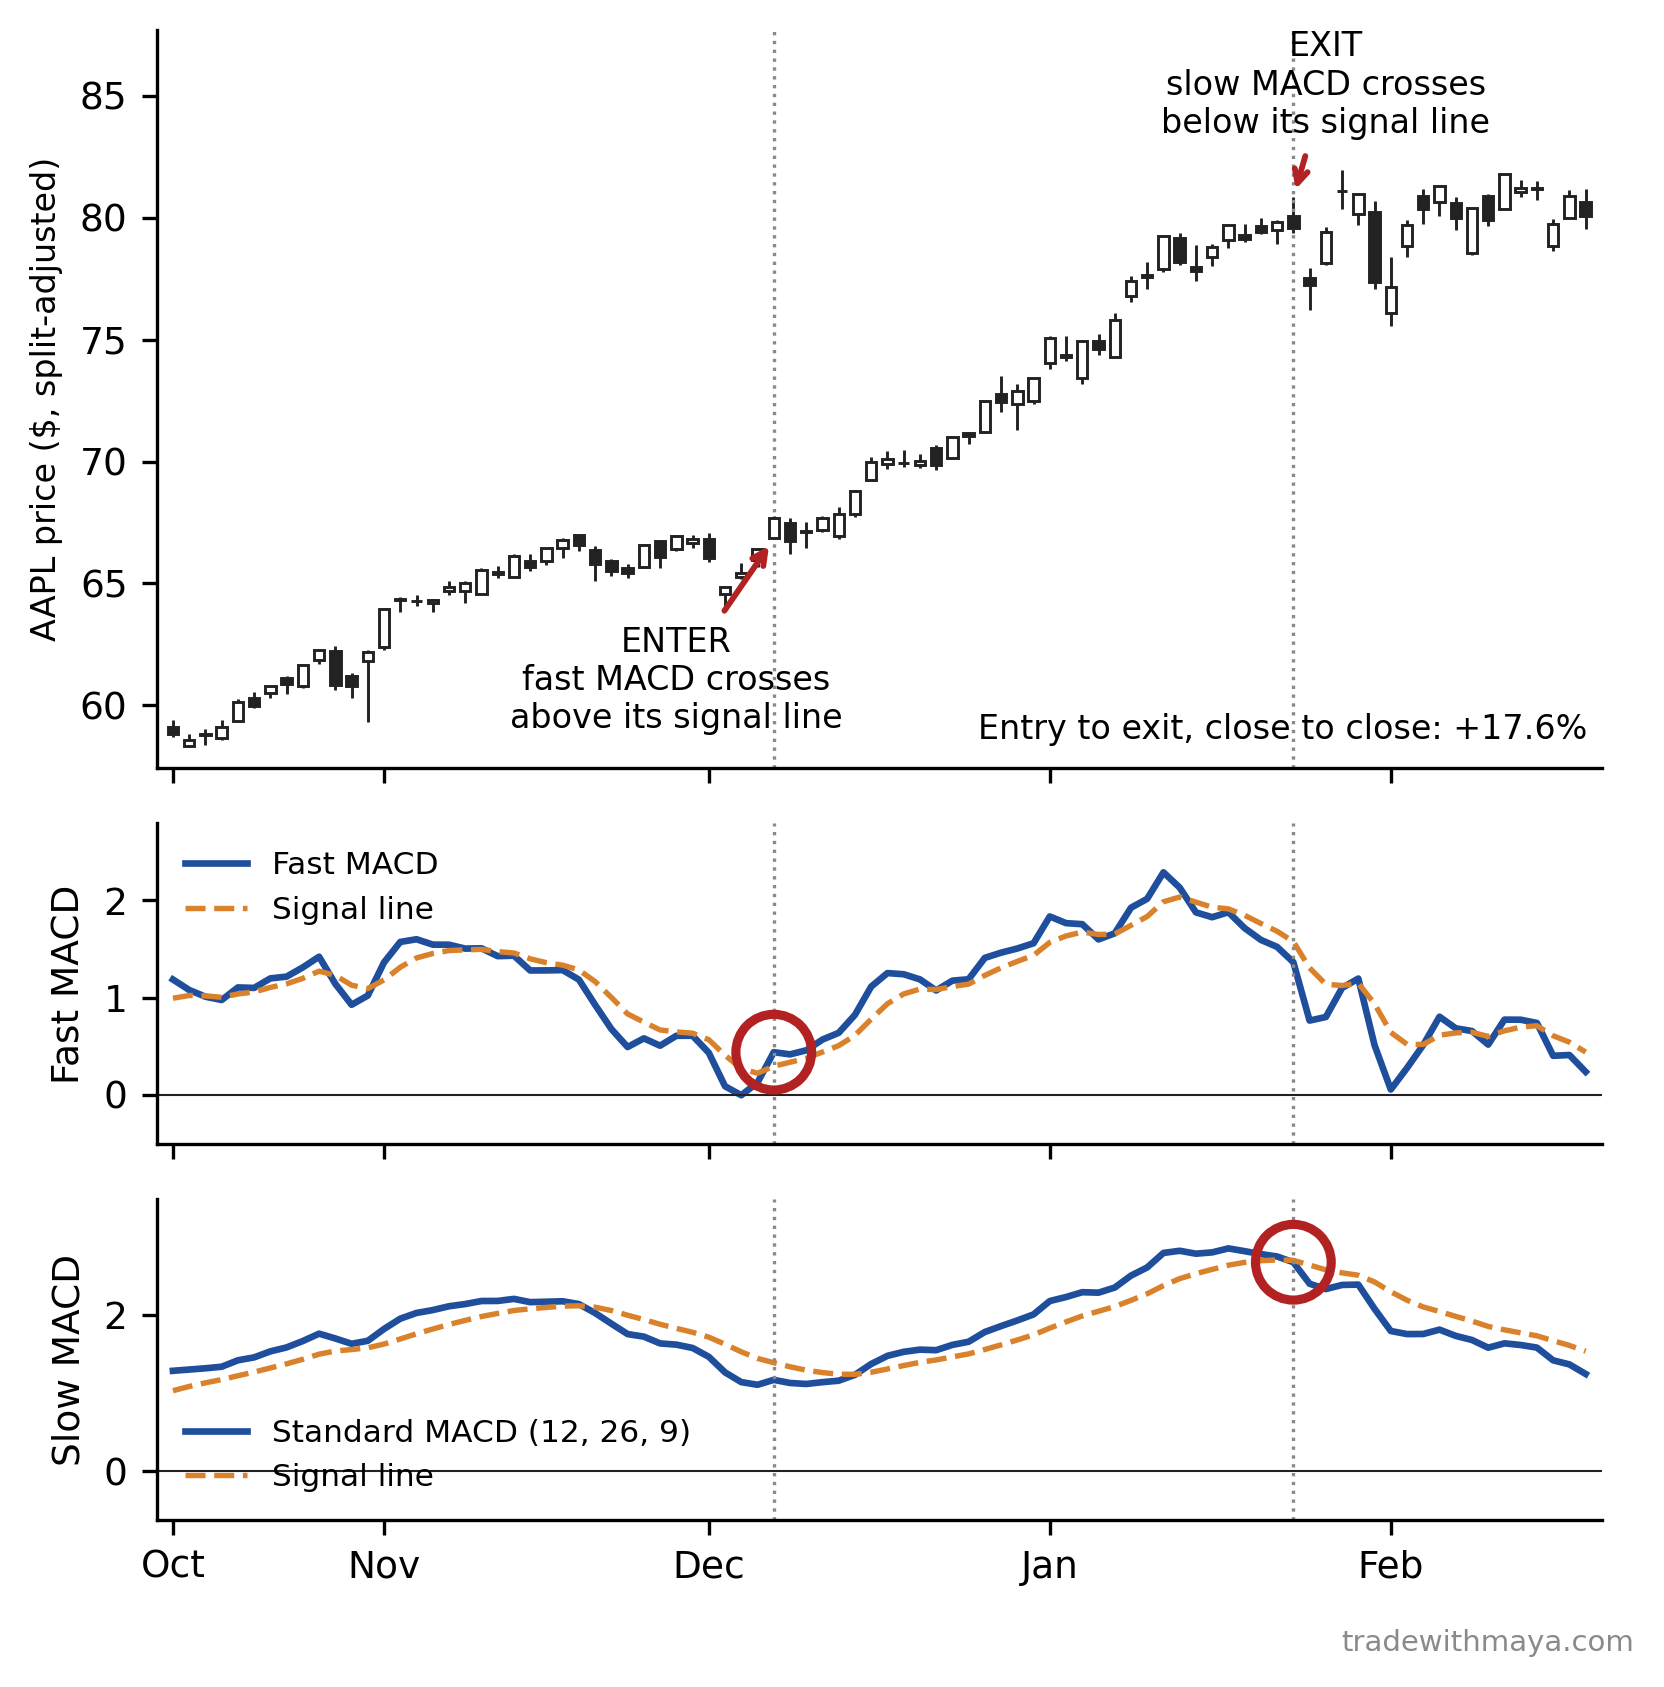
AAPL from October 2019 to February 2020, using split-adjusted prices.
AAPL from October 2019 to February 2020, using split-adjusted prices. Download full size
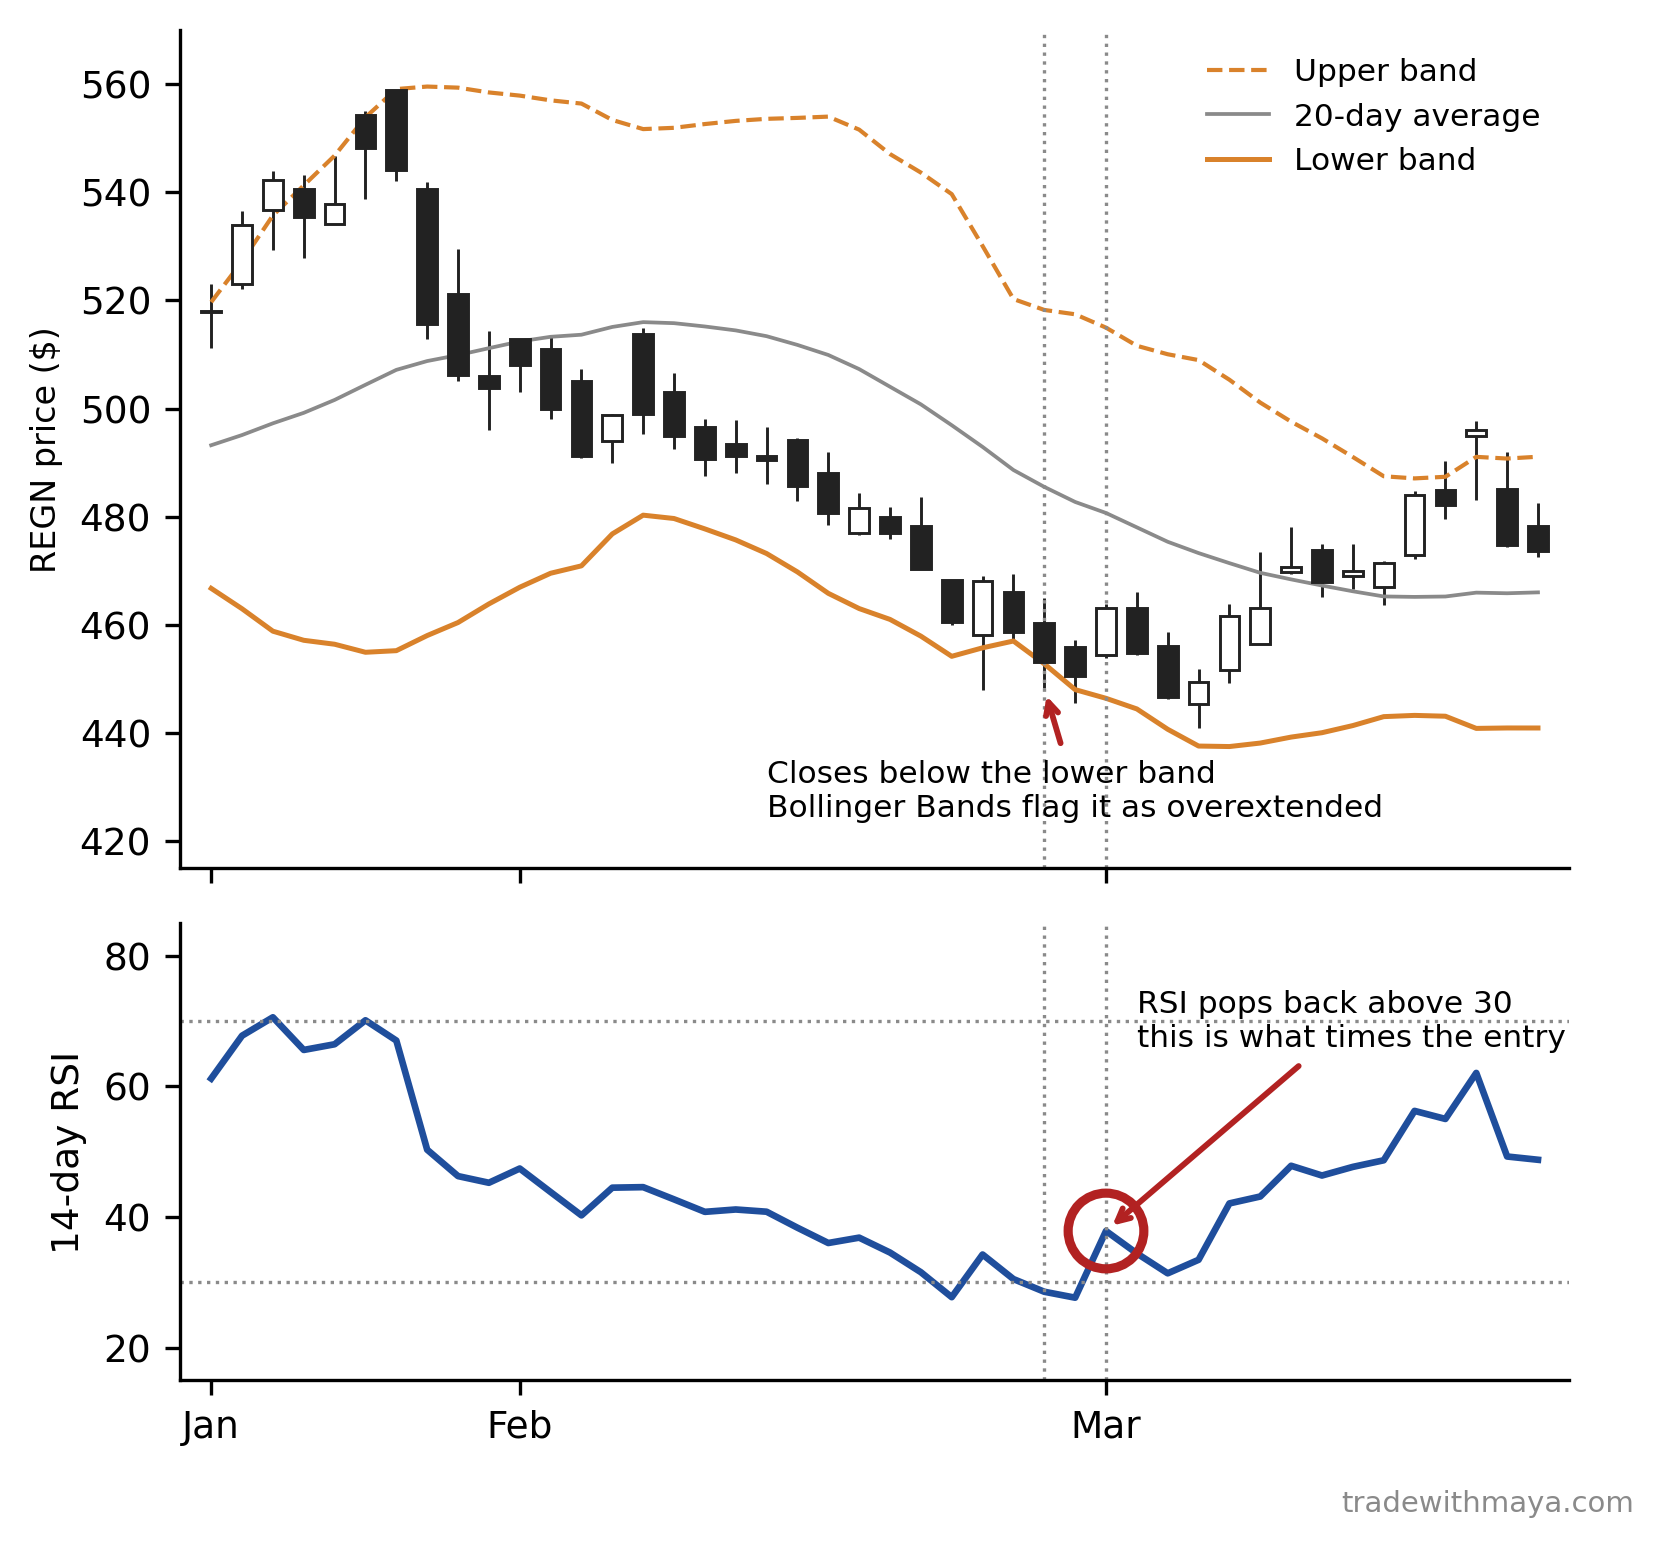
REGN from January to March 2021.
REGN from January to March 2021. Download full size
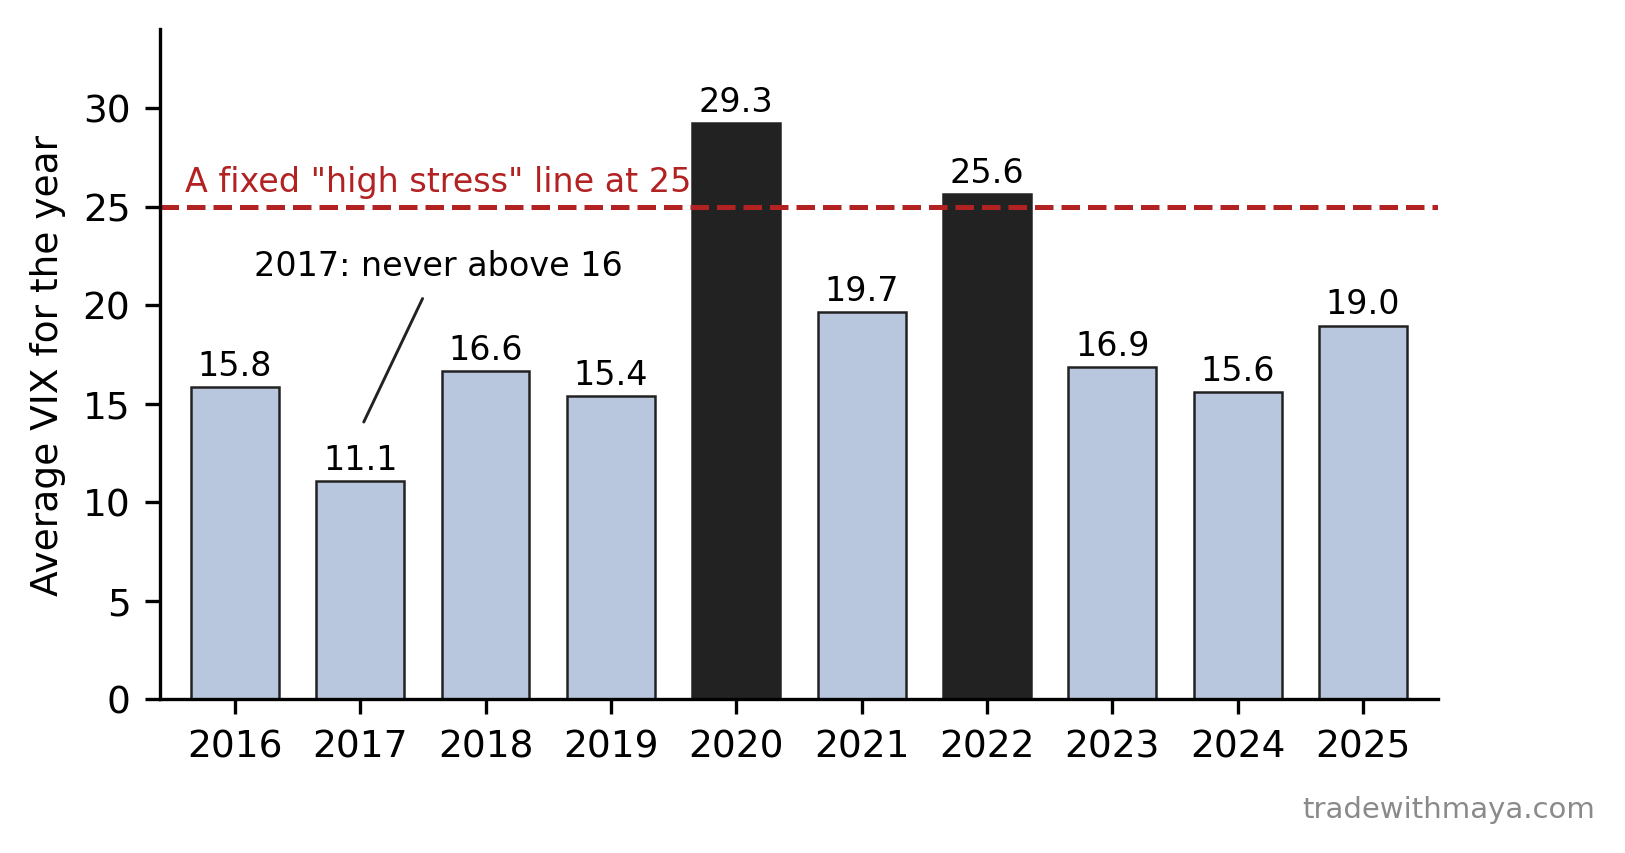
Average VIX by year.
Average VIX by year. Download full size
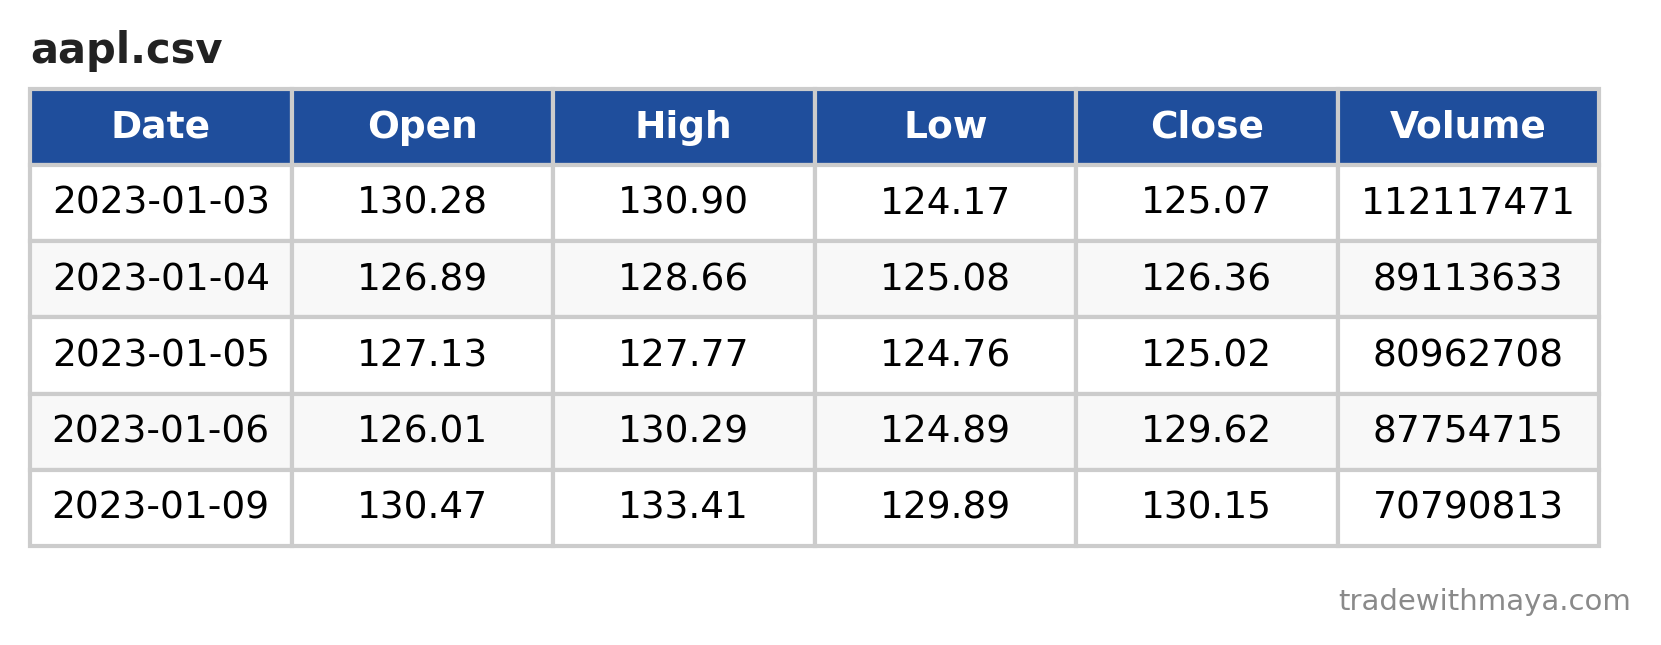
The first five rows of a real daily price download for AAPL, the kind of file you'd upload.
The first five rows of a real daily price download for AAPL, the kind of file you'd upload. Download full size
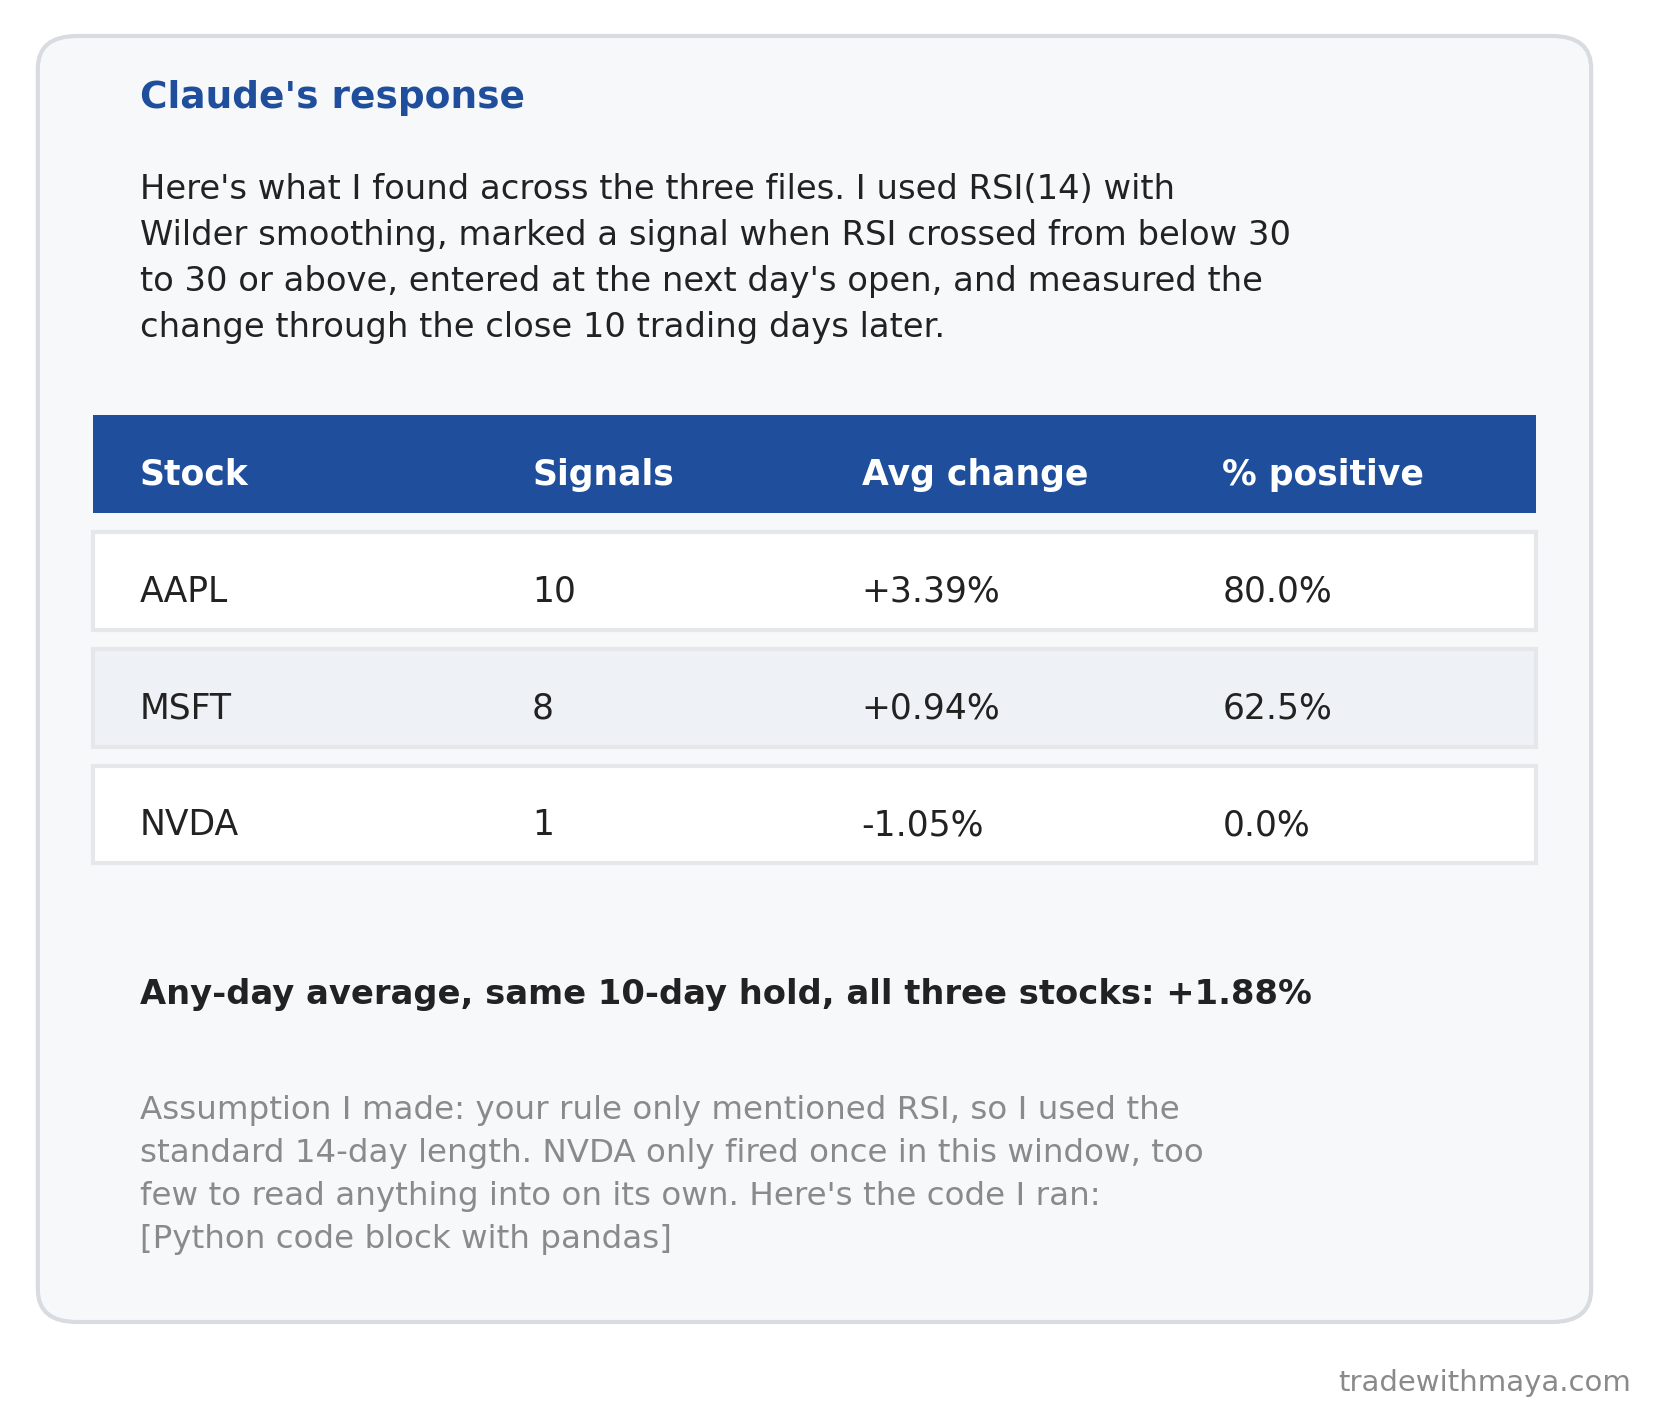
Claude's real response to the prompt above, run on real AAPL, MSFT, and NVDA price files.
Claude's real response to the prompt above, run on real AAPL, MSFT, and NVDA price files. Download full size
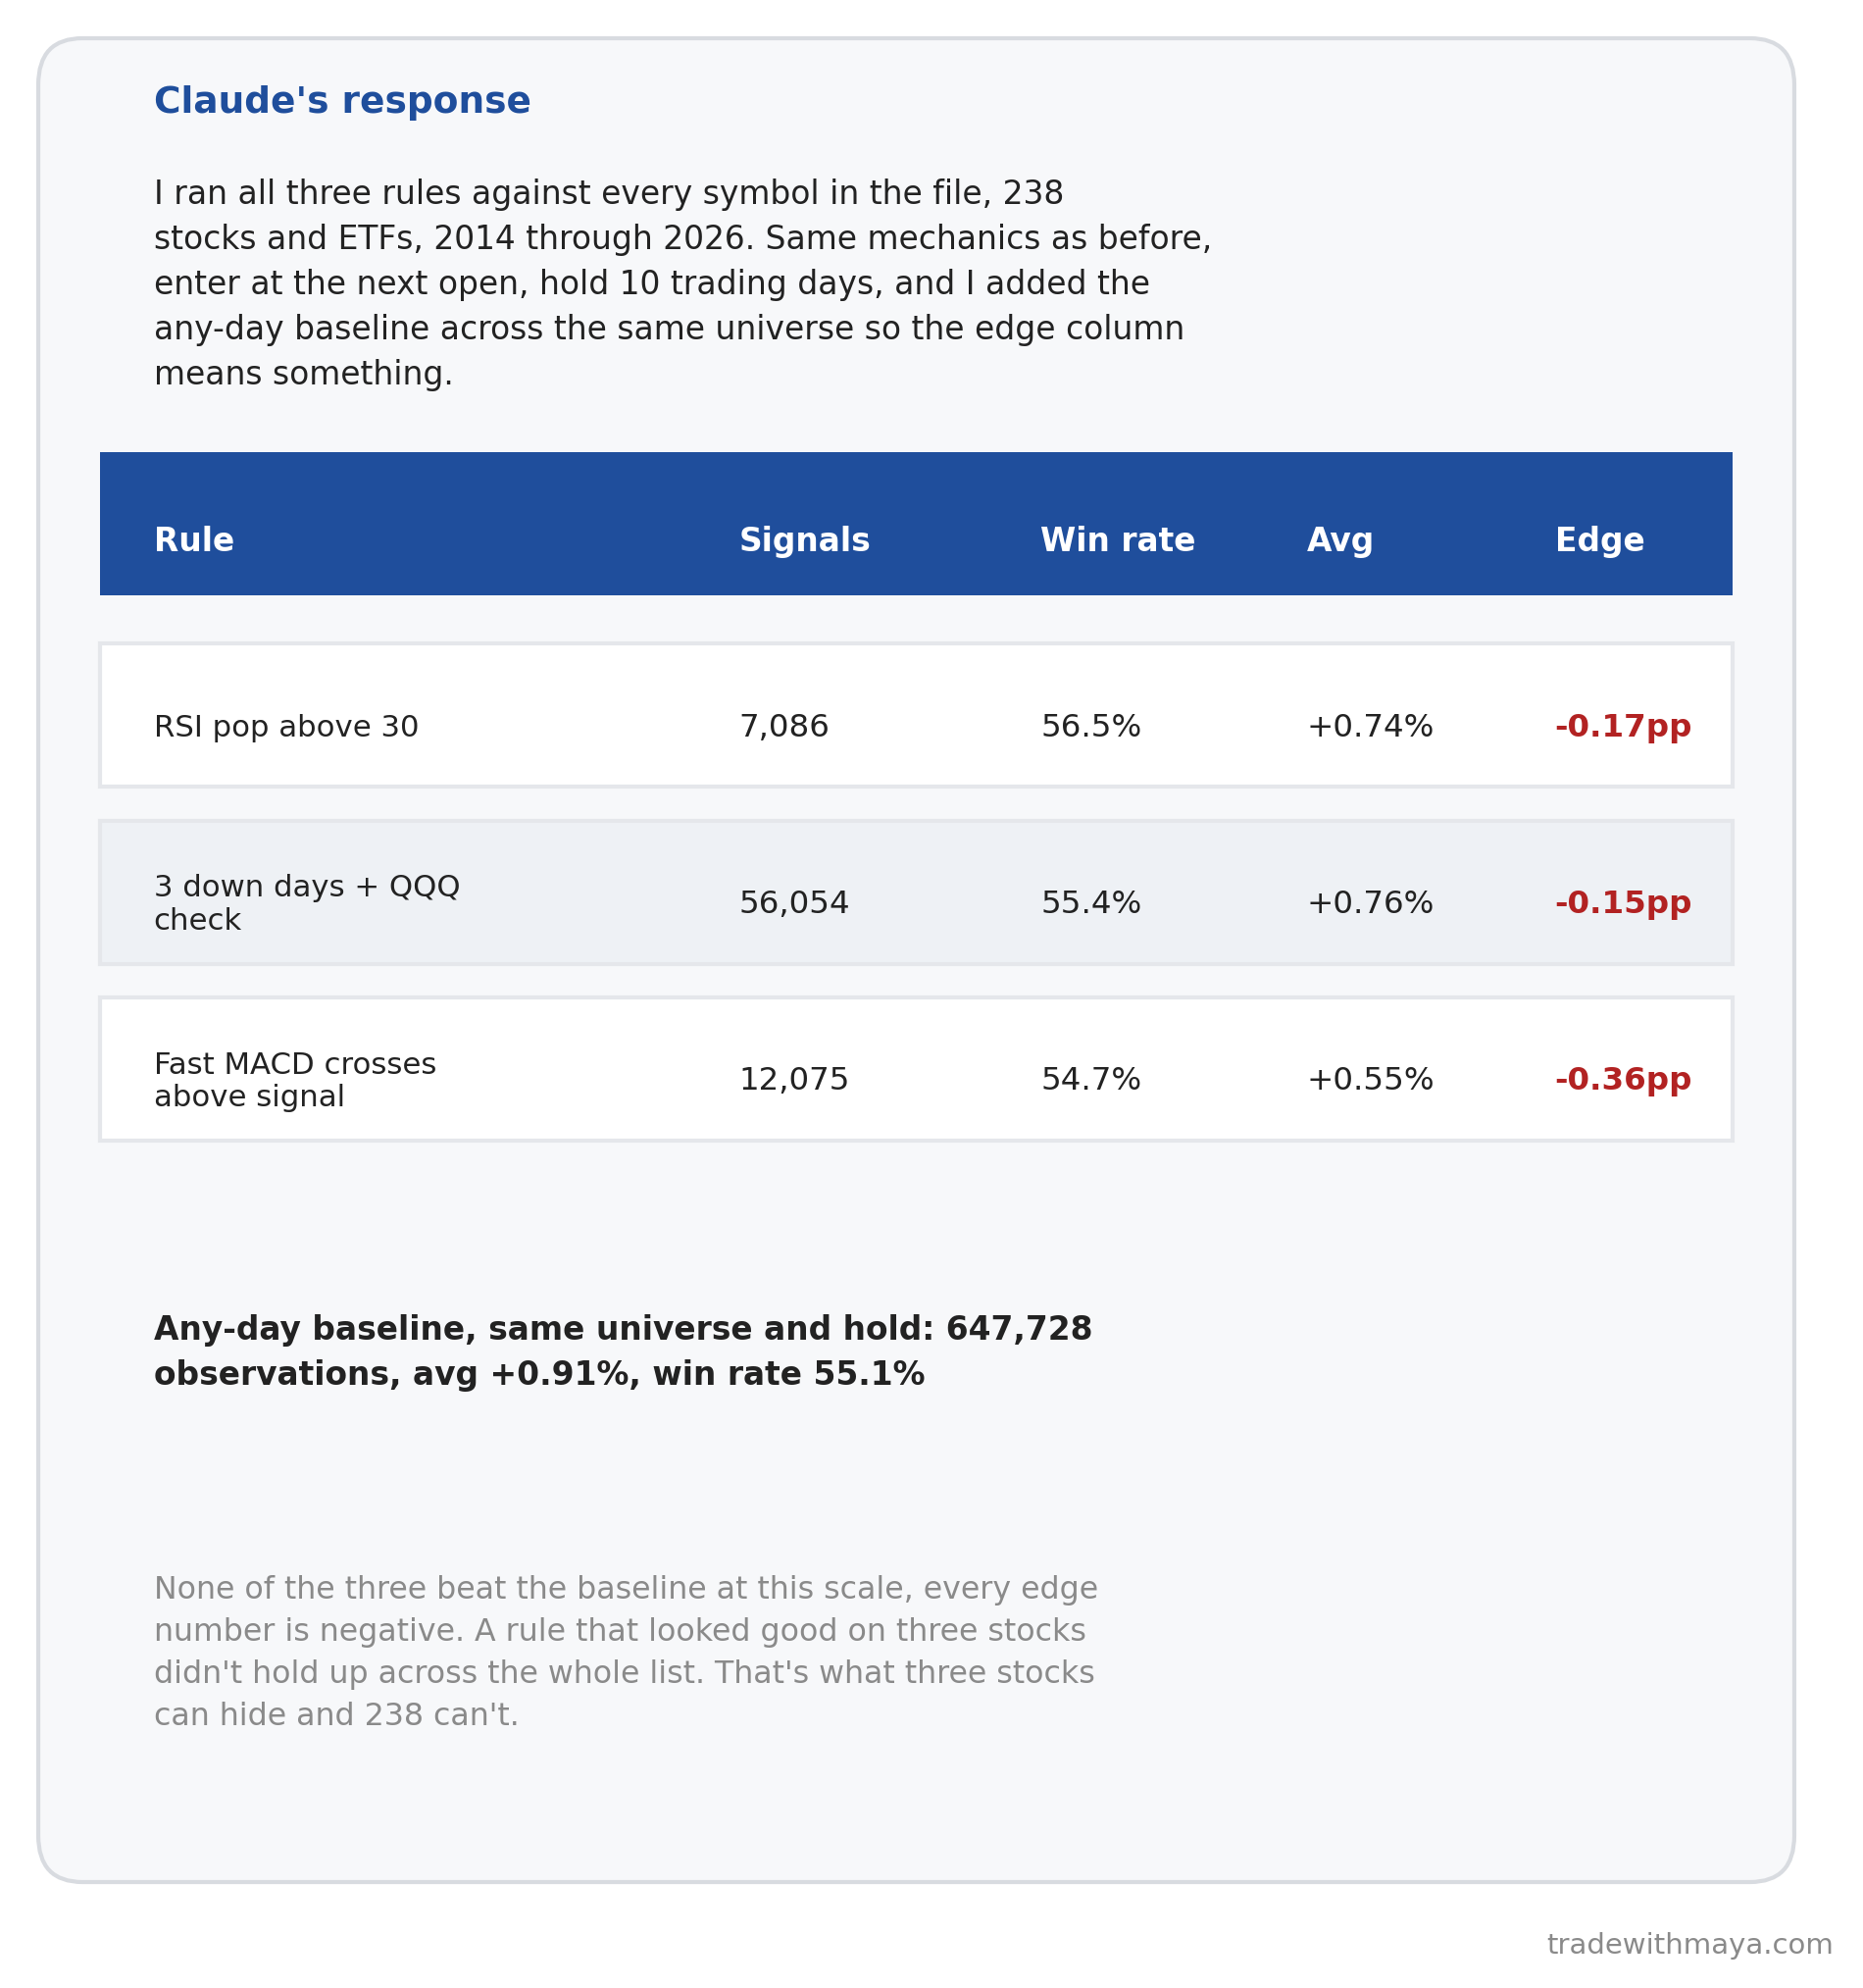
Claude's response to the same three rules, run on the full 238-symbol universe, 2014 through 2026.
Claude's response to the same three rules, run on the full 238-symbol universe, 2014 through 2026. Download full size

Chapter 7: Reading the Market Before You Read a StockBack to top
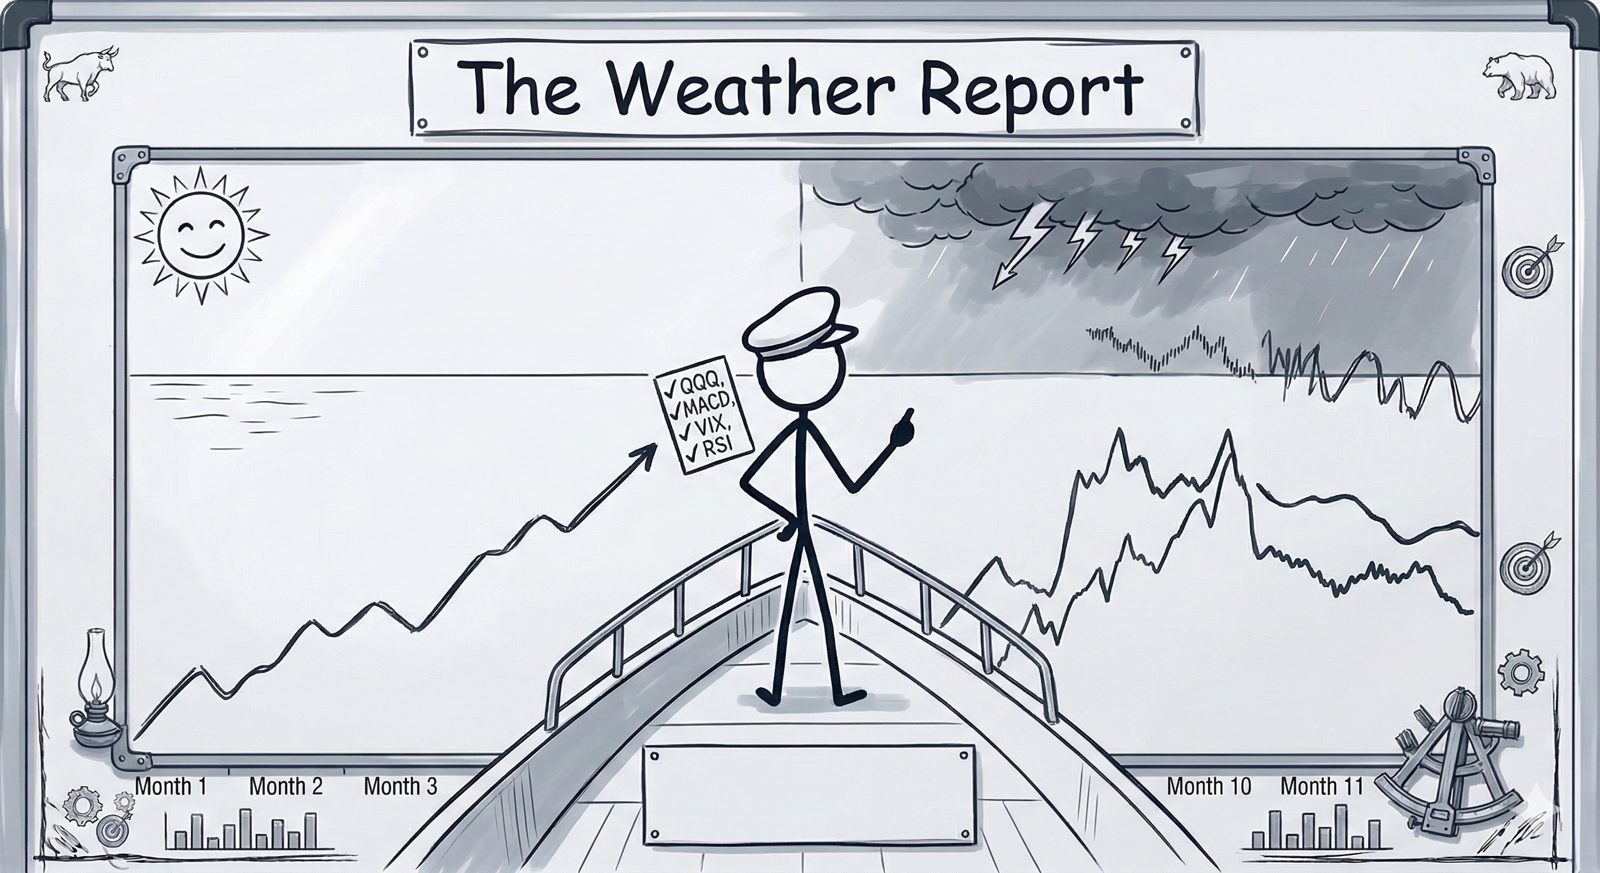
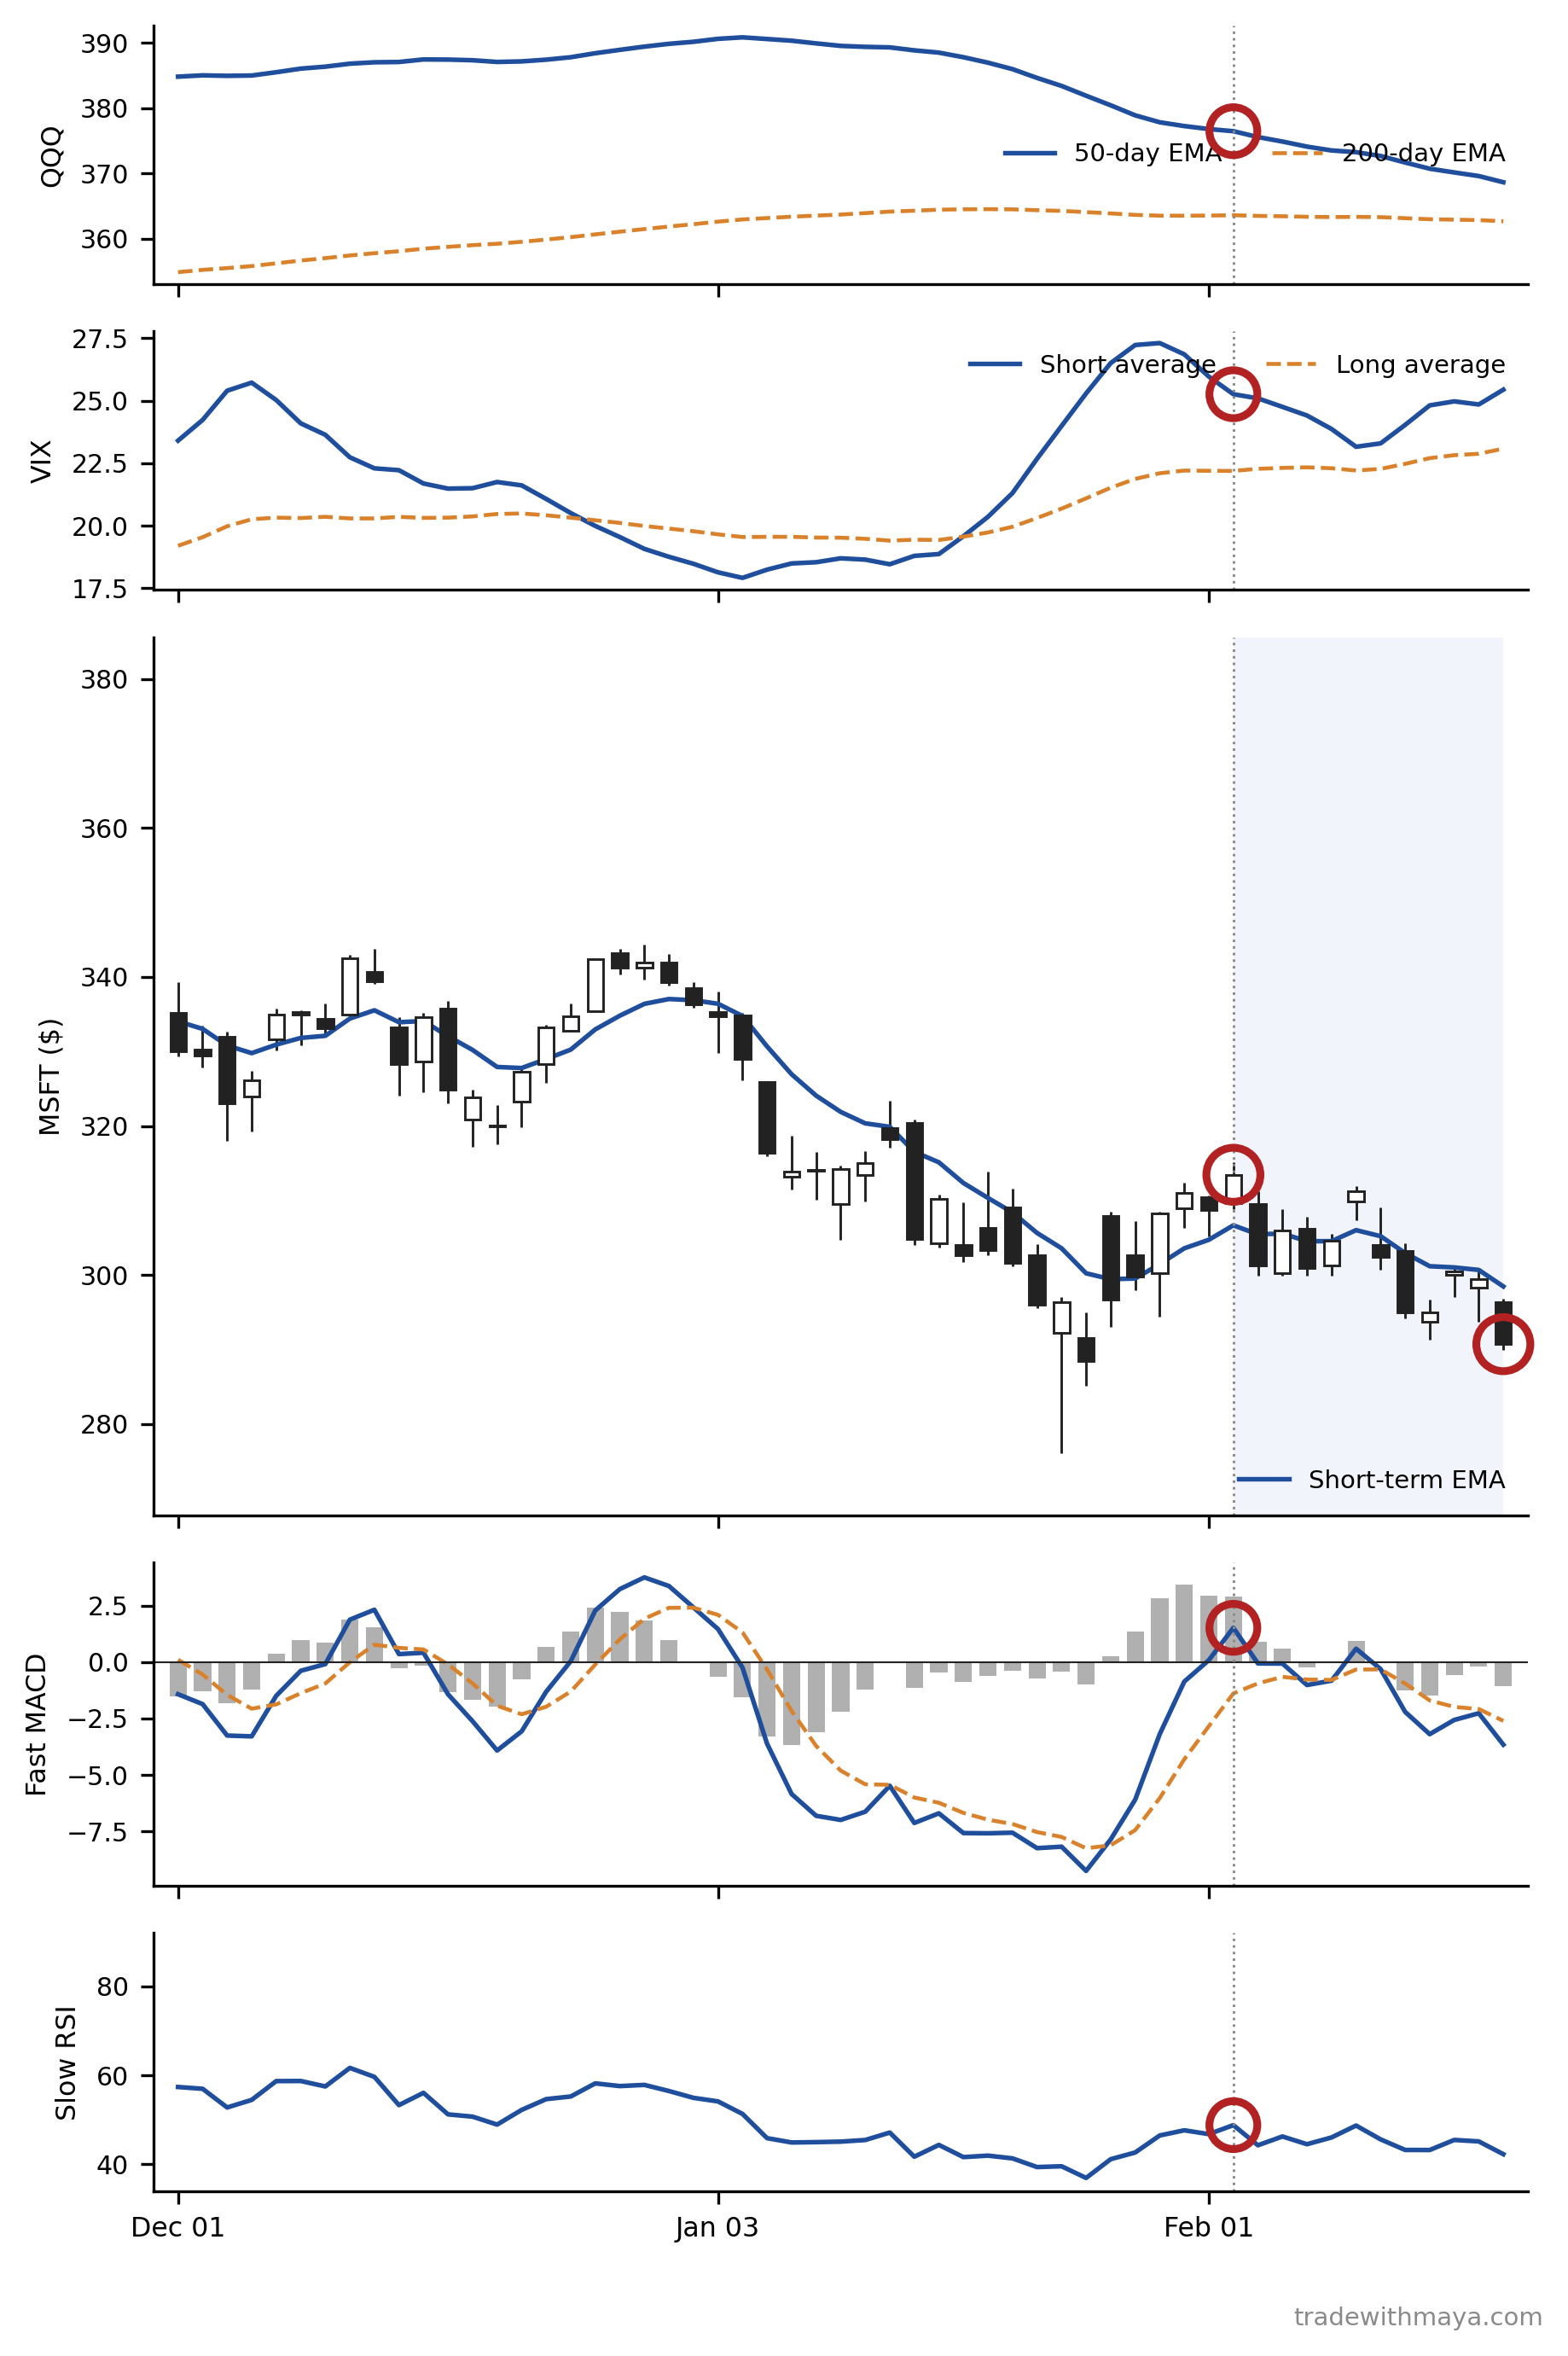
A whiteboard titled The Weather Report: a ship's captain stands on a bridge holding a checklist of QQQ, MACD, VIX, and RSI, sailing from calm sunny water with a rising price chart toward a stormy...
A whiteboard titled The Weather Report: a ship's captain stands on a bridge holding a checklist of QQQ, MACD, VIX, and RSI, sailing from calm sunny water with a rising price chart toward a stormy... Download full size
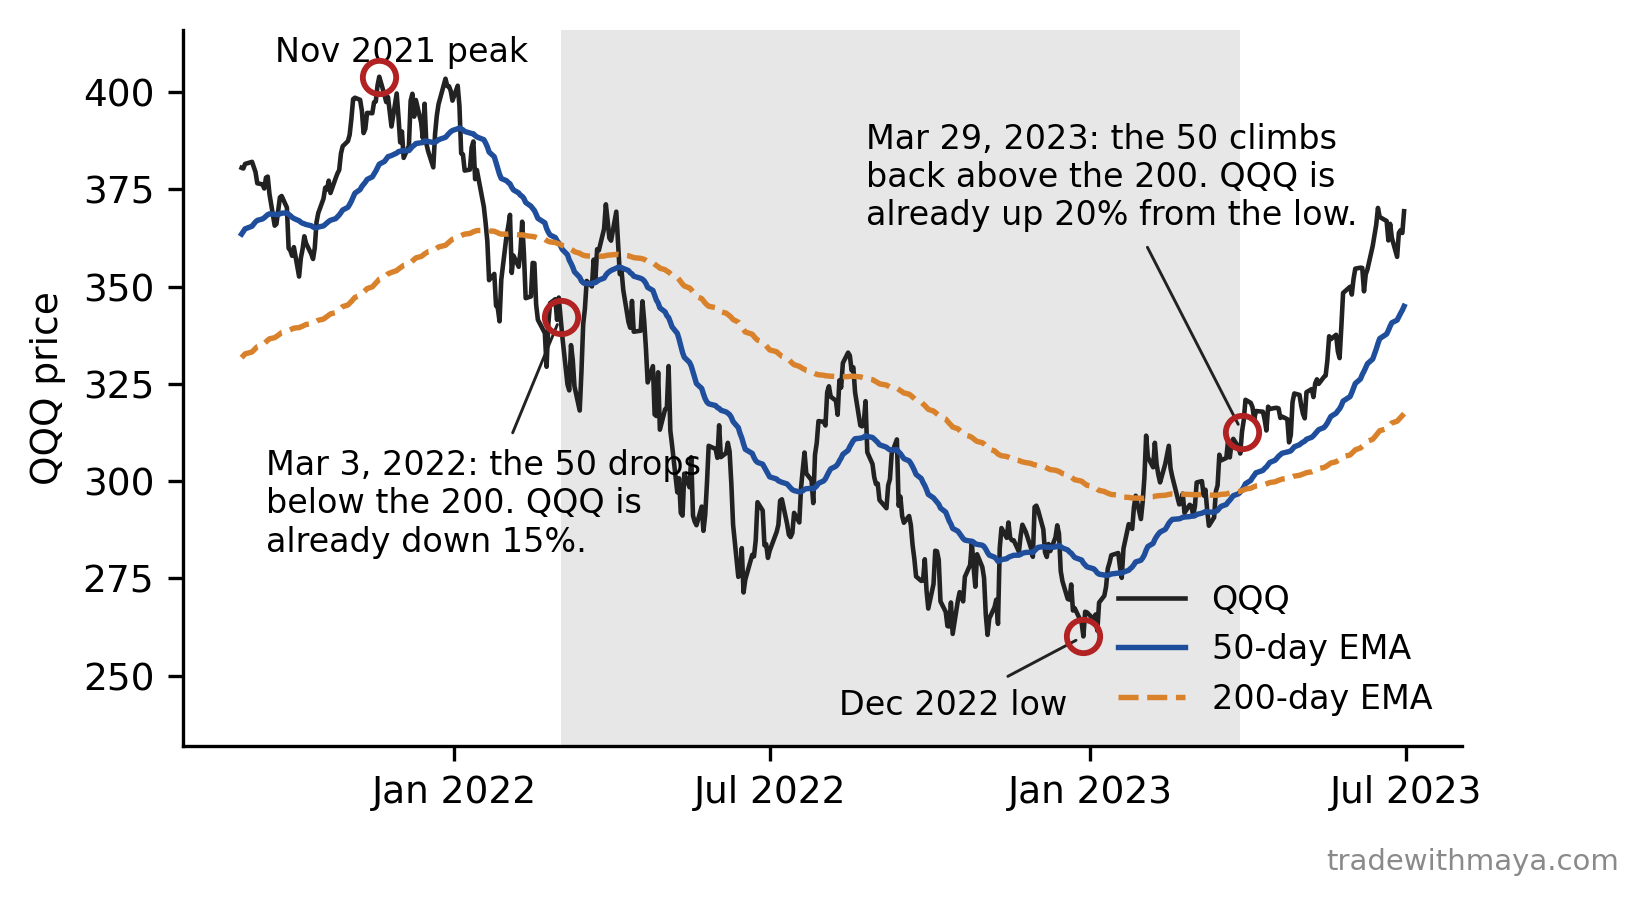
QQQ through the 2022 bear market.
QQQ through the 2022 bear market. Download full size
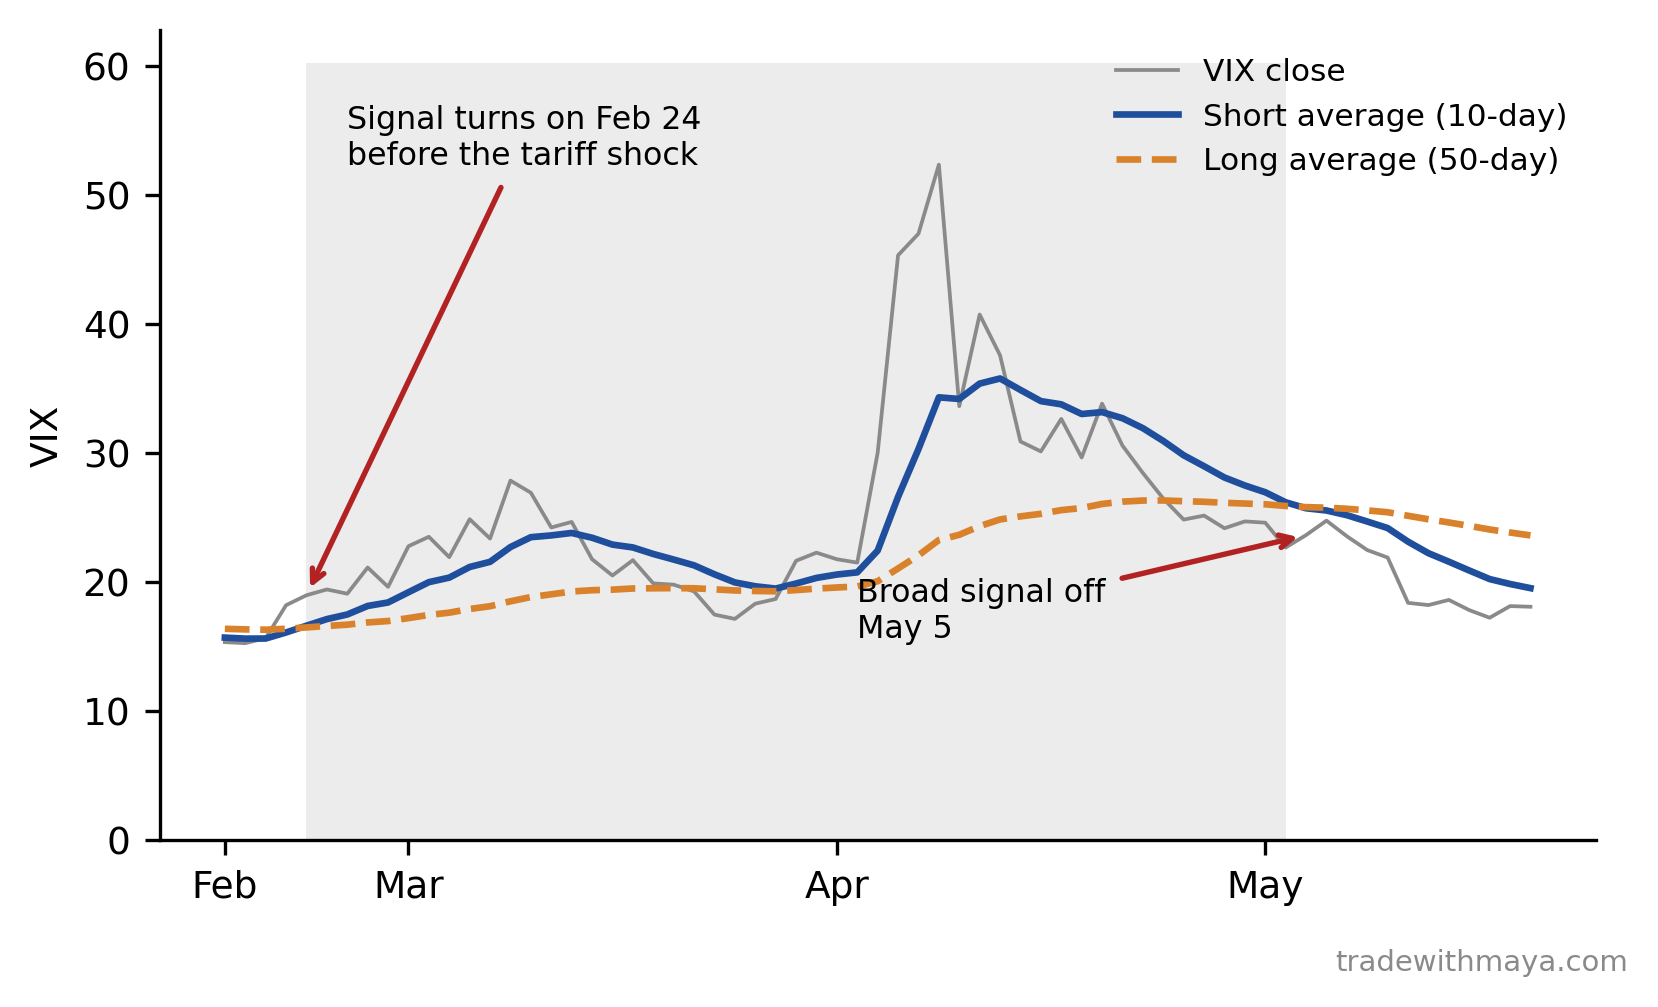
VIX, its short and long average, and the pullback signal from February to May 2025.
VIX, its short and long average, and the pullback signal from February to May 2025. Download full size
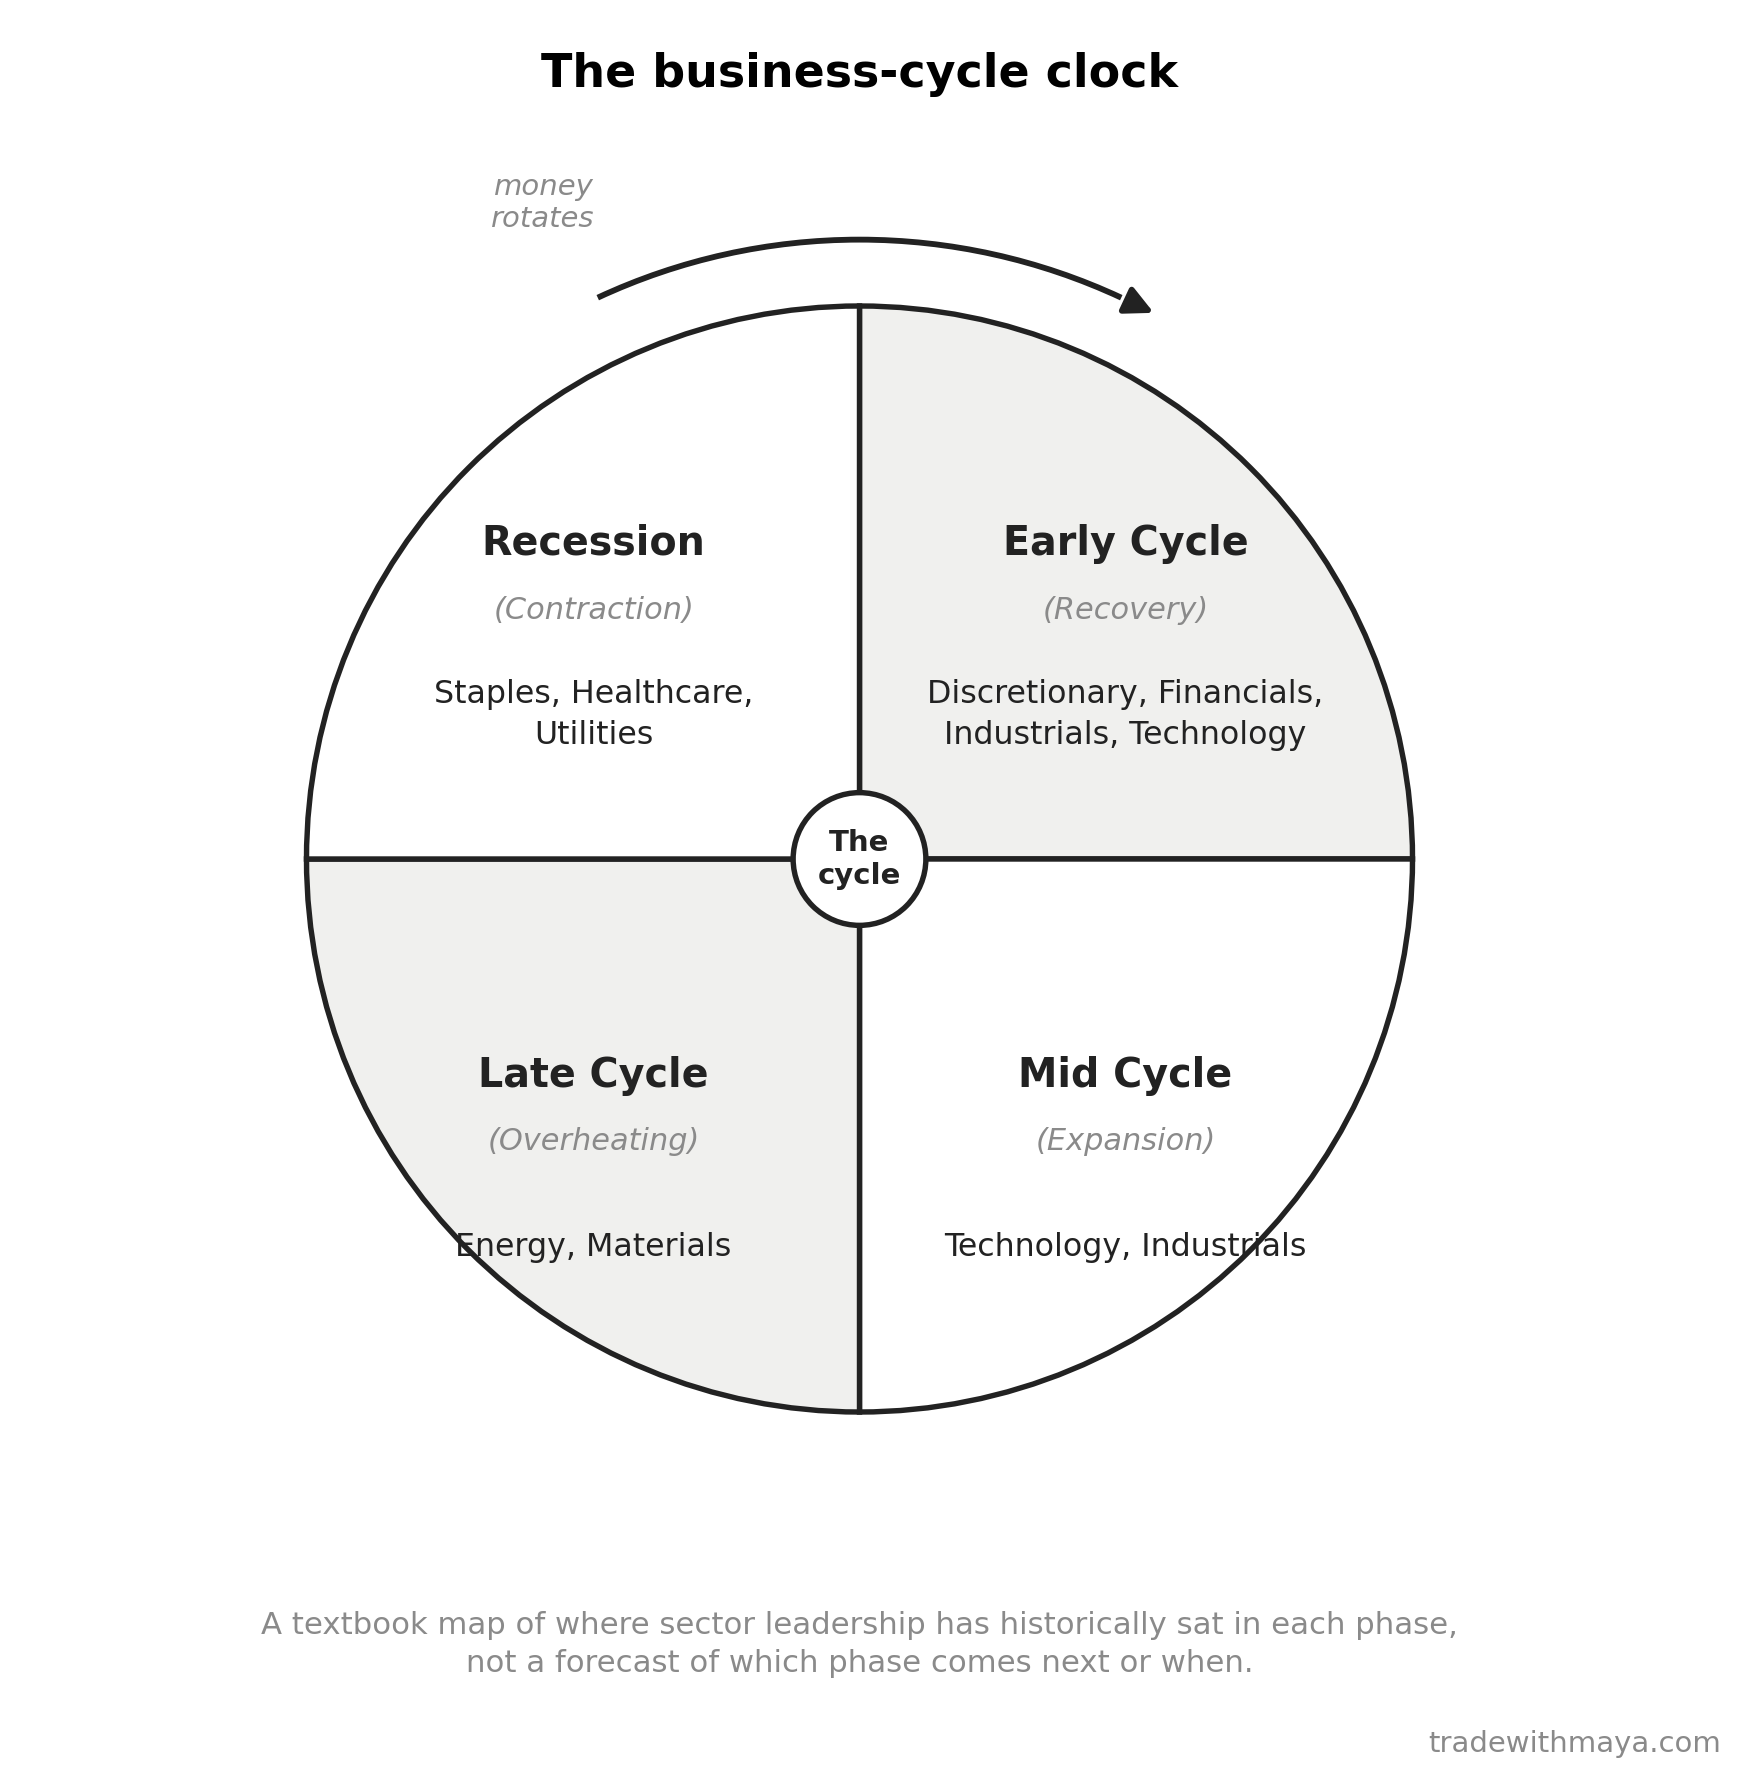
An original diagram of the business-cycle clock, the four textbook economic phases mapped to the sectors that typically lead in each, redrawn from the standard framework and not a reproduction of...
An original diagram of the business-cycle clock, the four textbook economic phases mapped to the sectors that typically lead in each, redrawn from the standard framework and not a reproduction of... Download full size
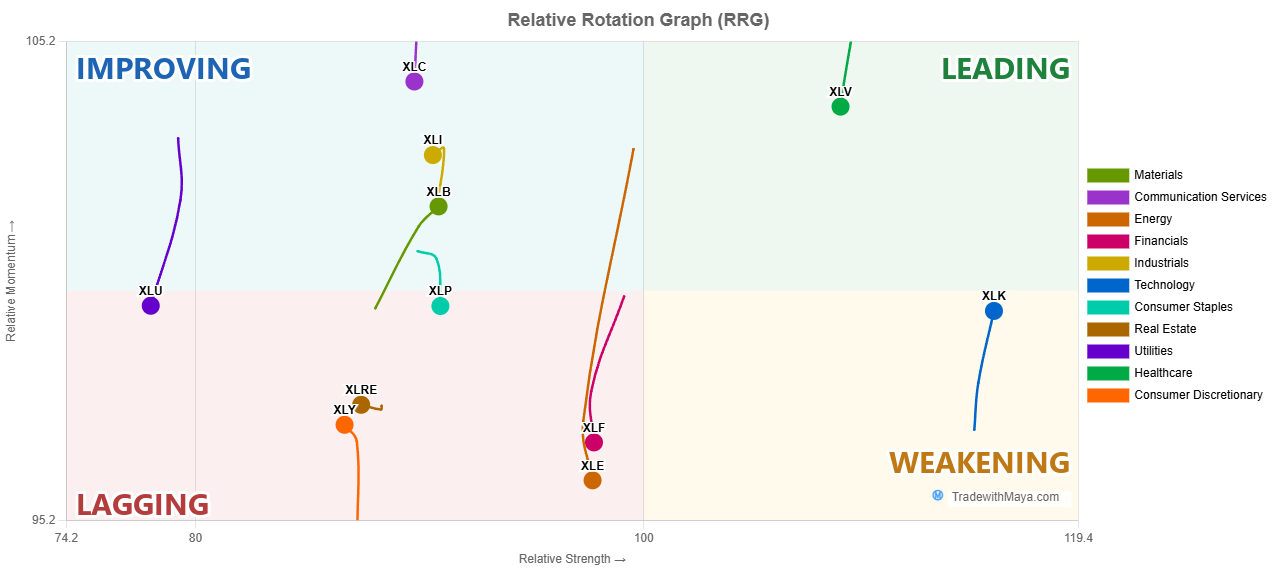
The live RRG chart from tradewithmaya.com as of September 23, 2026, with the four quadrants labeled.
The live RRG chart from tradewithmaya.com as of September 23, 2026, with the four quadrants labeled. Download full size
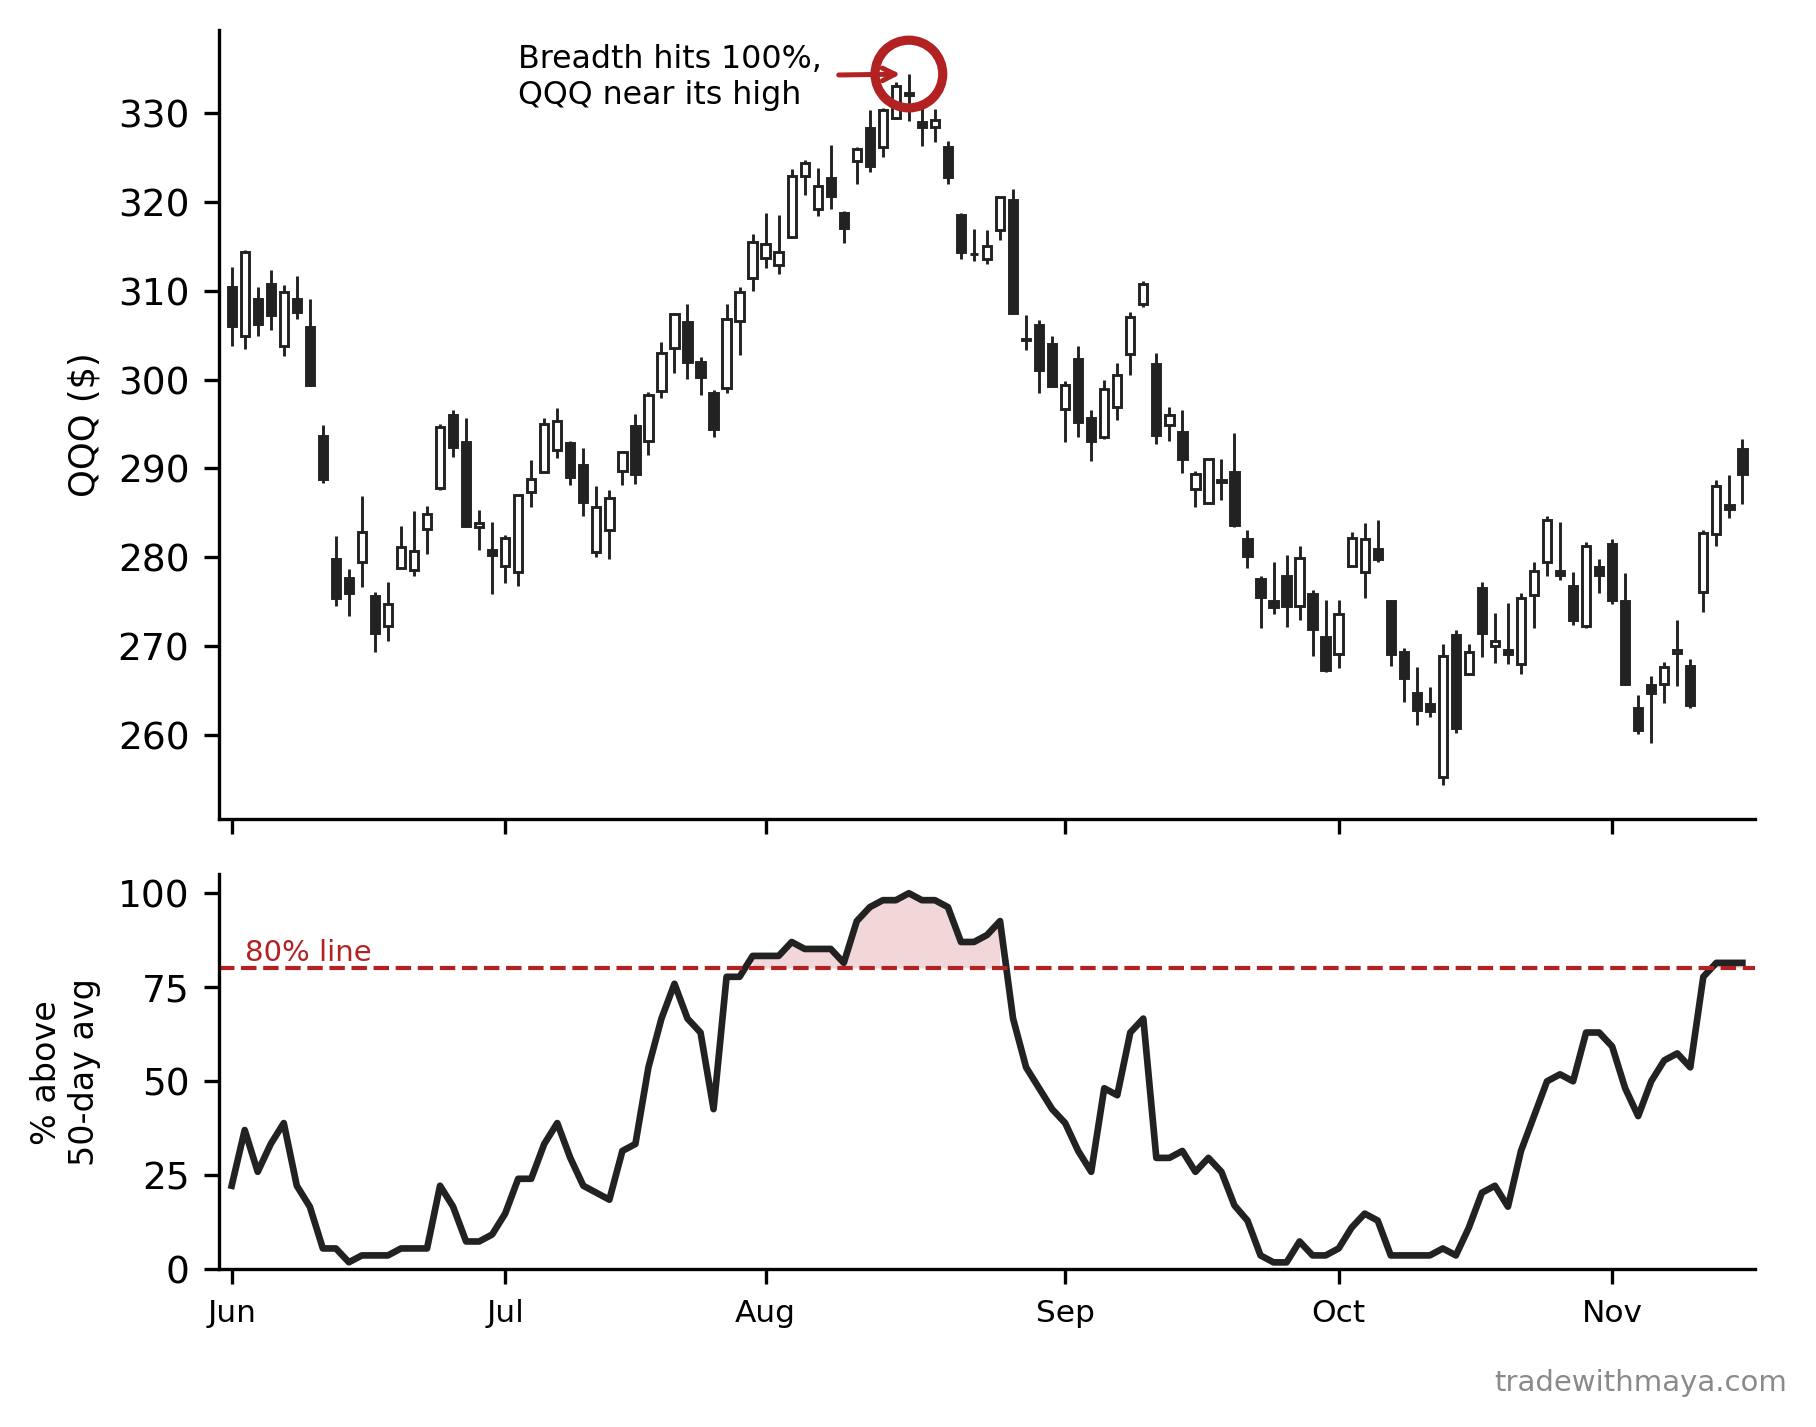
QQQ against the percentage of a 55-stock watchlist trading above its own 50-day average, June through November 2022.
QQQ against the percentage of a 55-stock watchlist trading above its own 50-day average, June through November 2022. Download full size
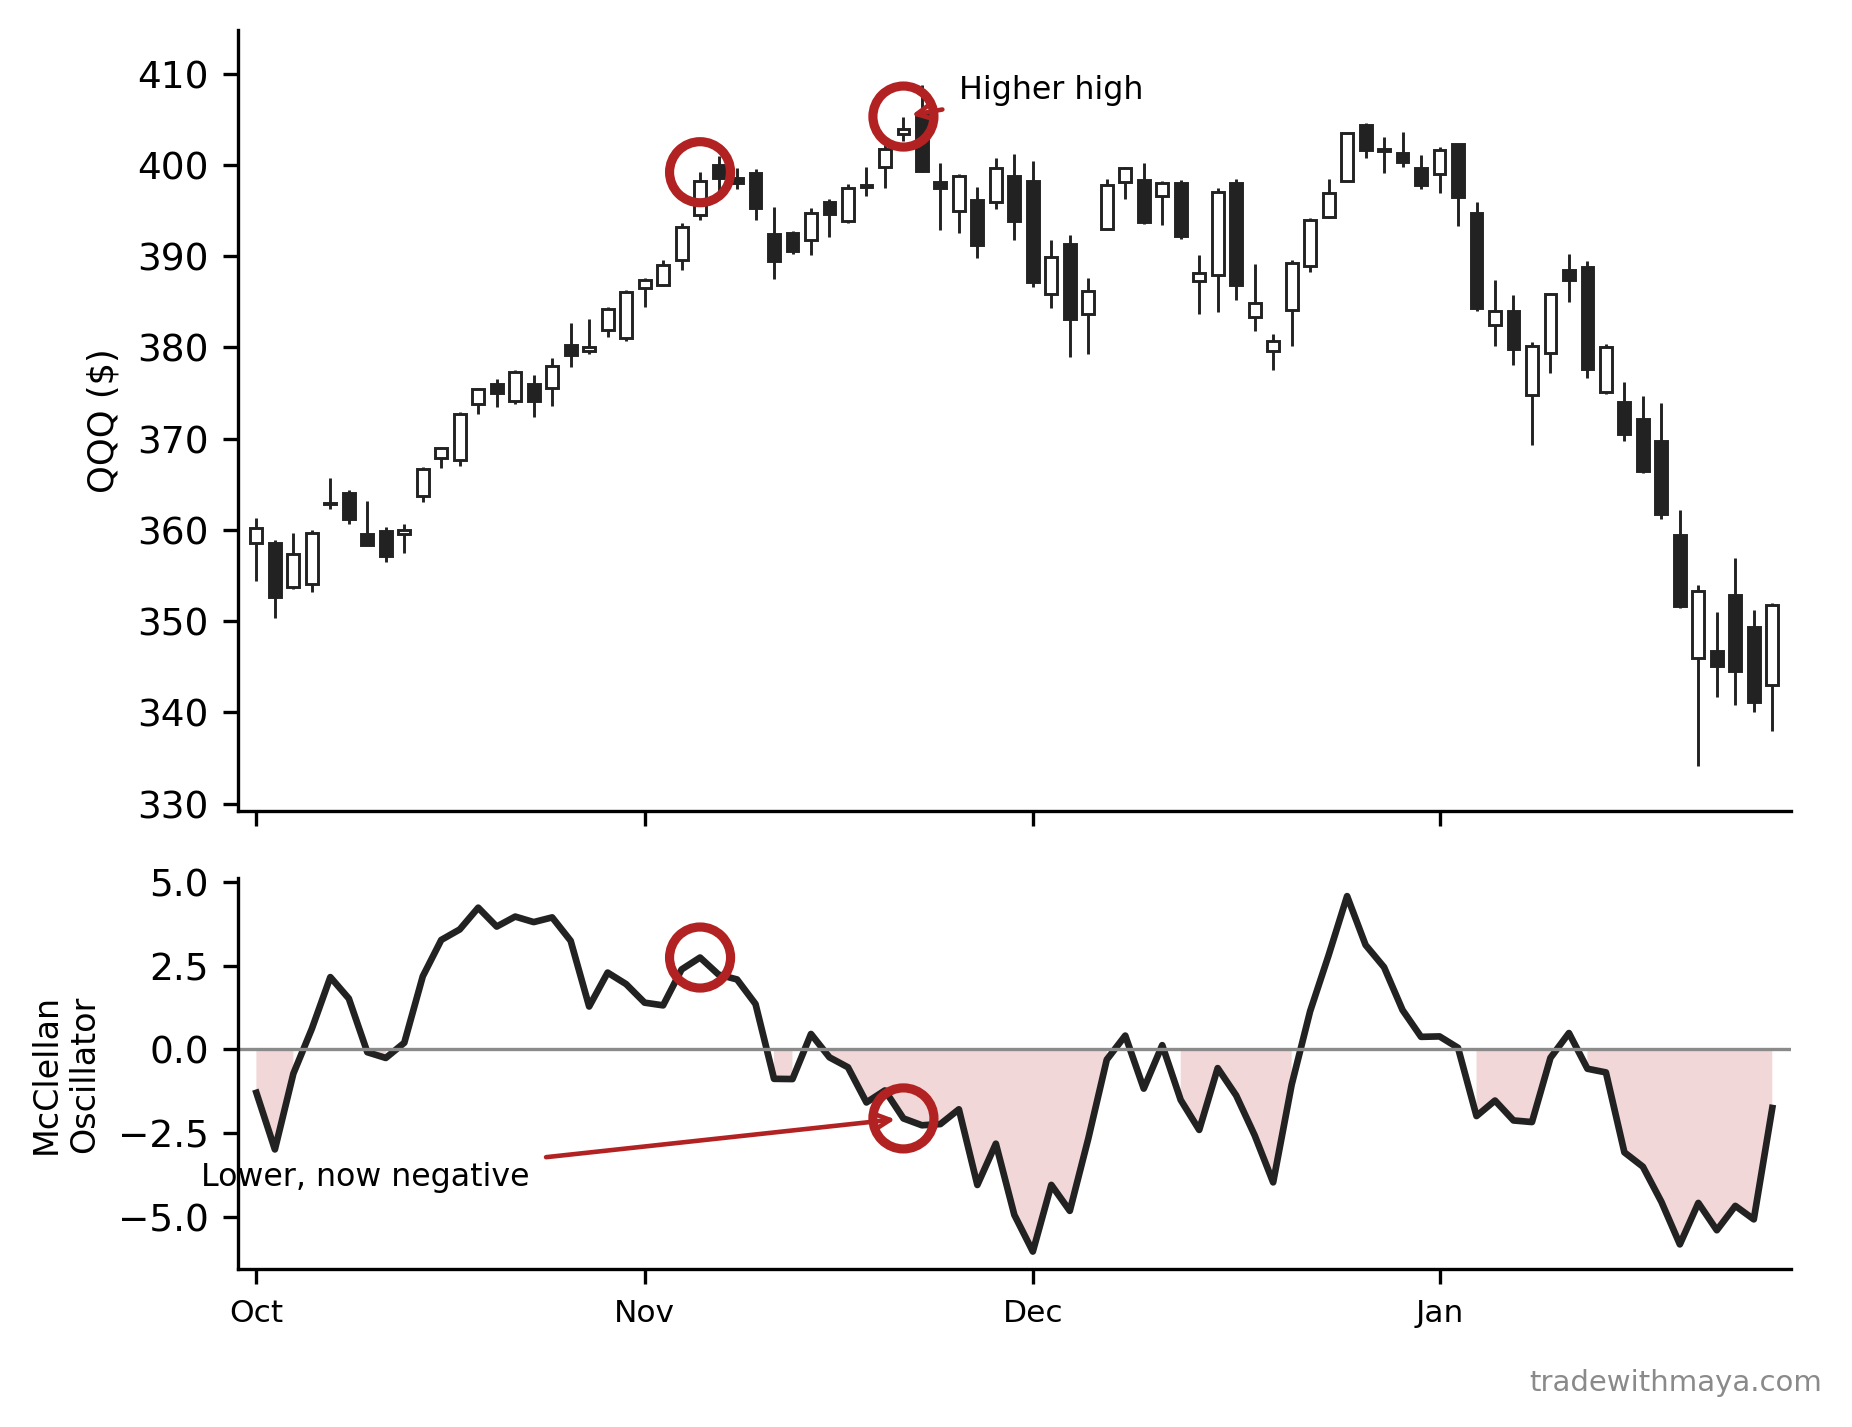
QQQ against the McClellan Oscillator, October 2021 through January 2022.
QQQ against the McClellan Oscillator, October 2021 through January 2022. Download full size
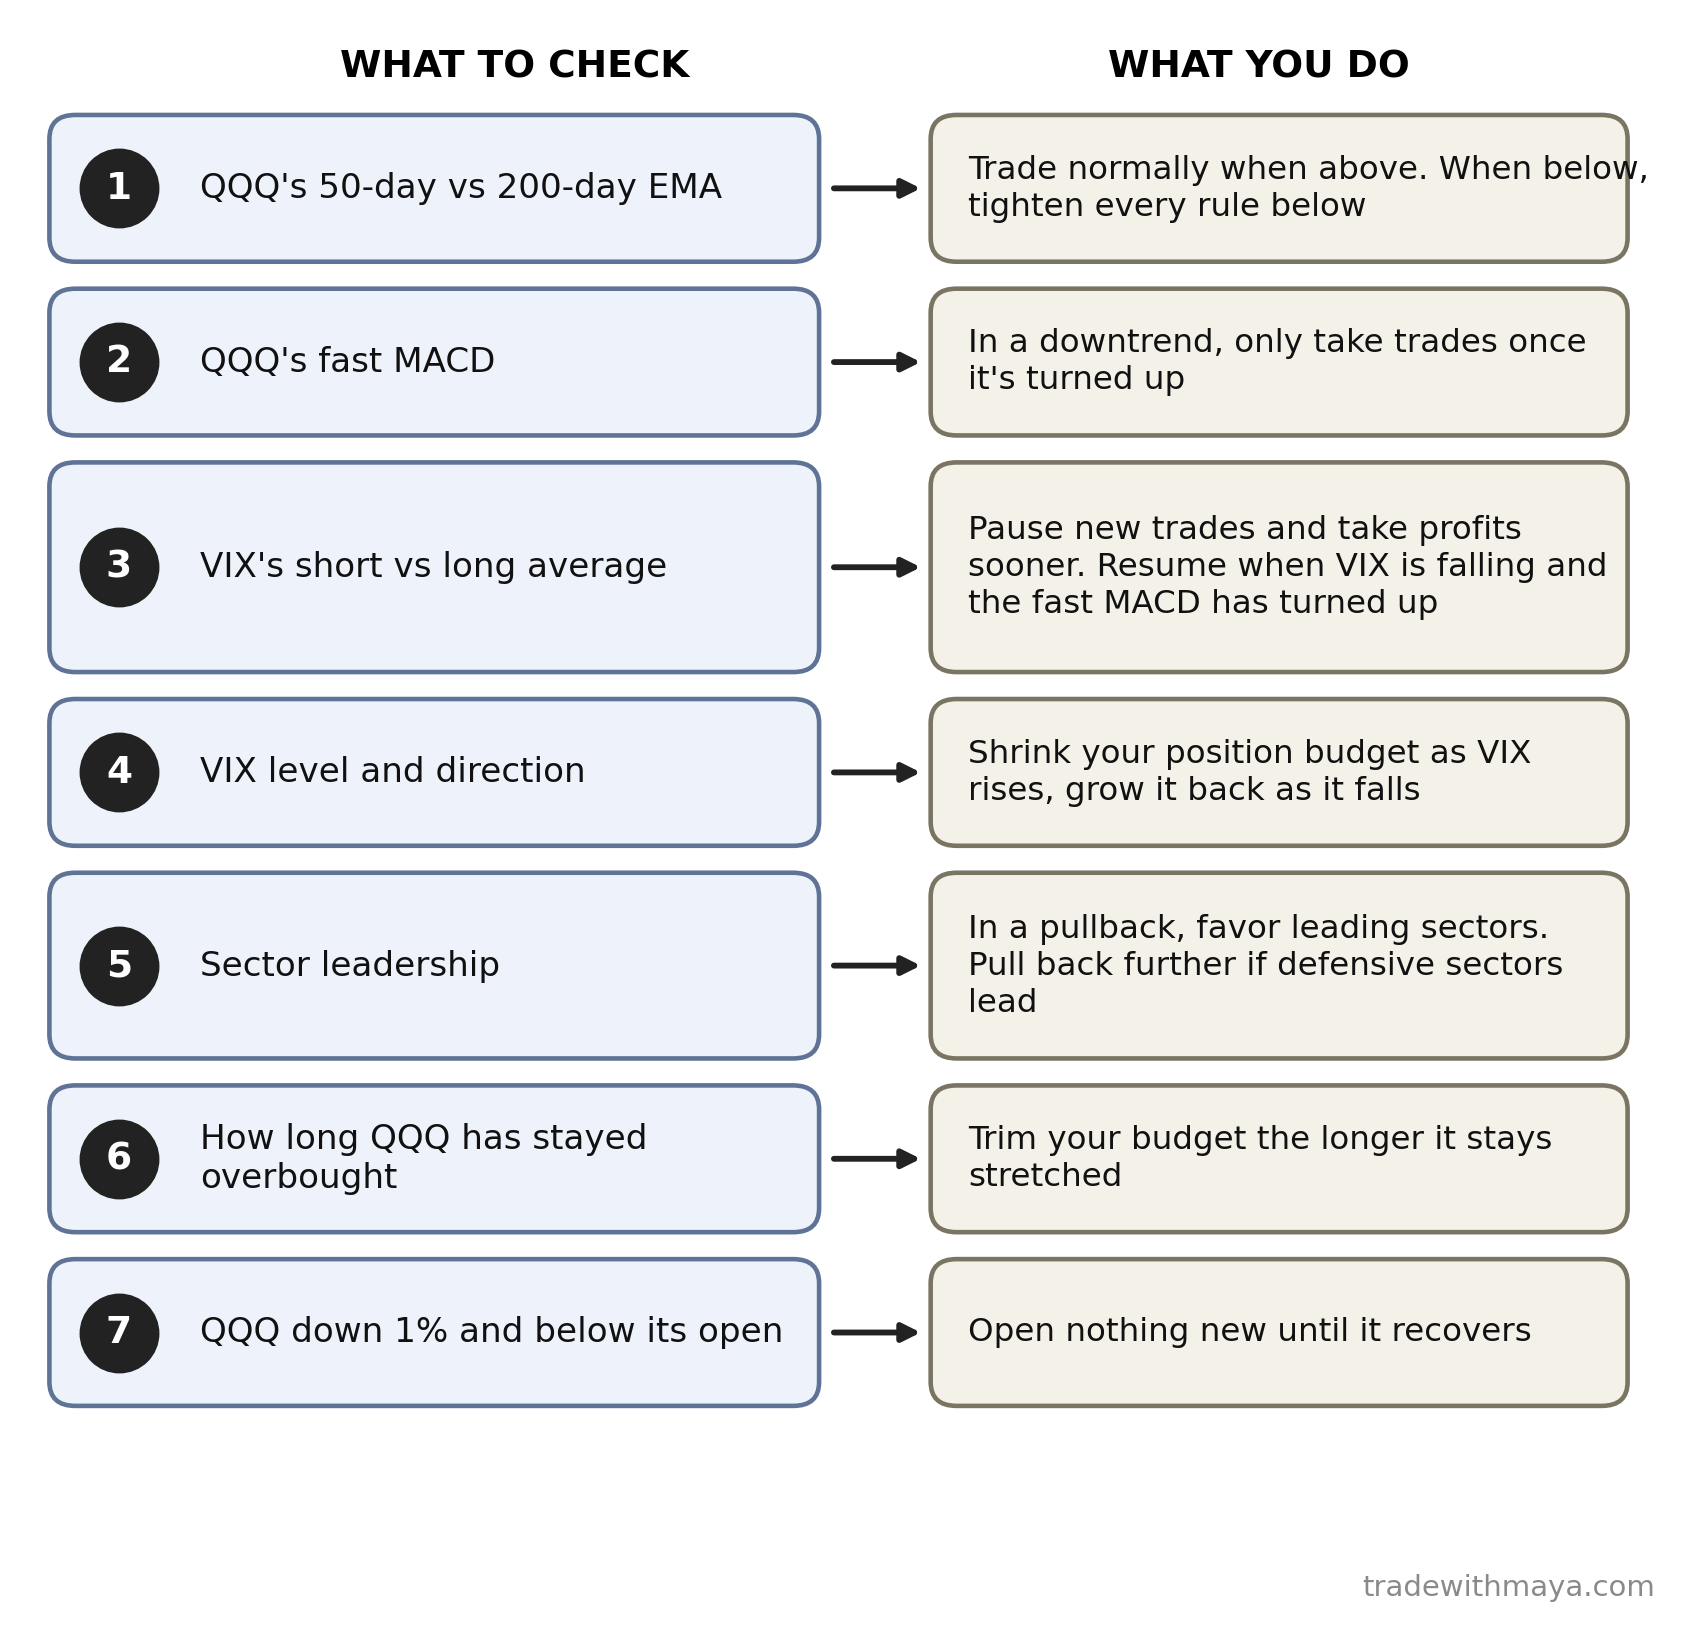
Seven market readings and the action that goes with each one.
Seven market readings and the action that goes with each one. Download full size

Chapter 8: Entries: Making Every Stock Earn Its Way InBack to top
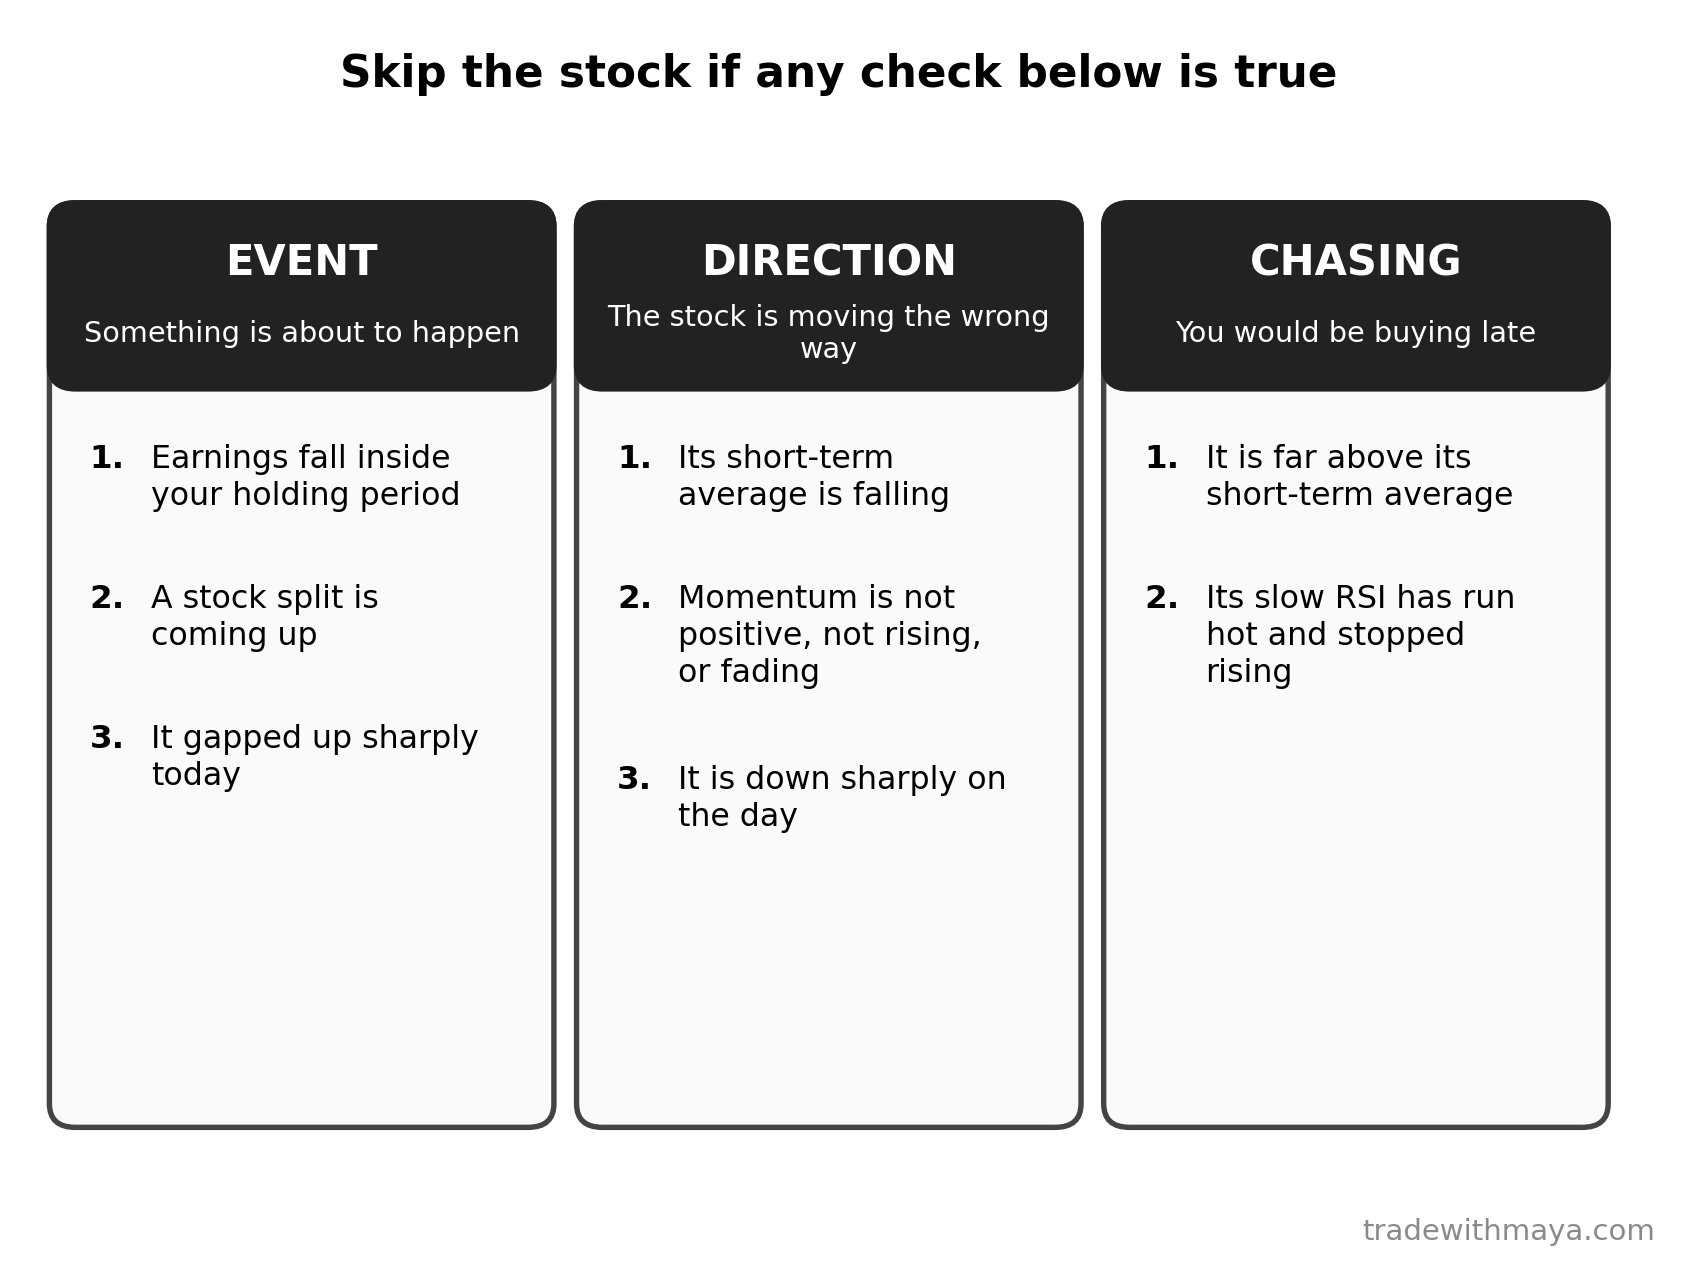
The checklist grouped by the kind of trap each rule avoids.
The checklist grouped by the kind of trap each rule avoids. Download full size
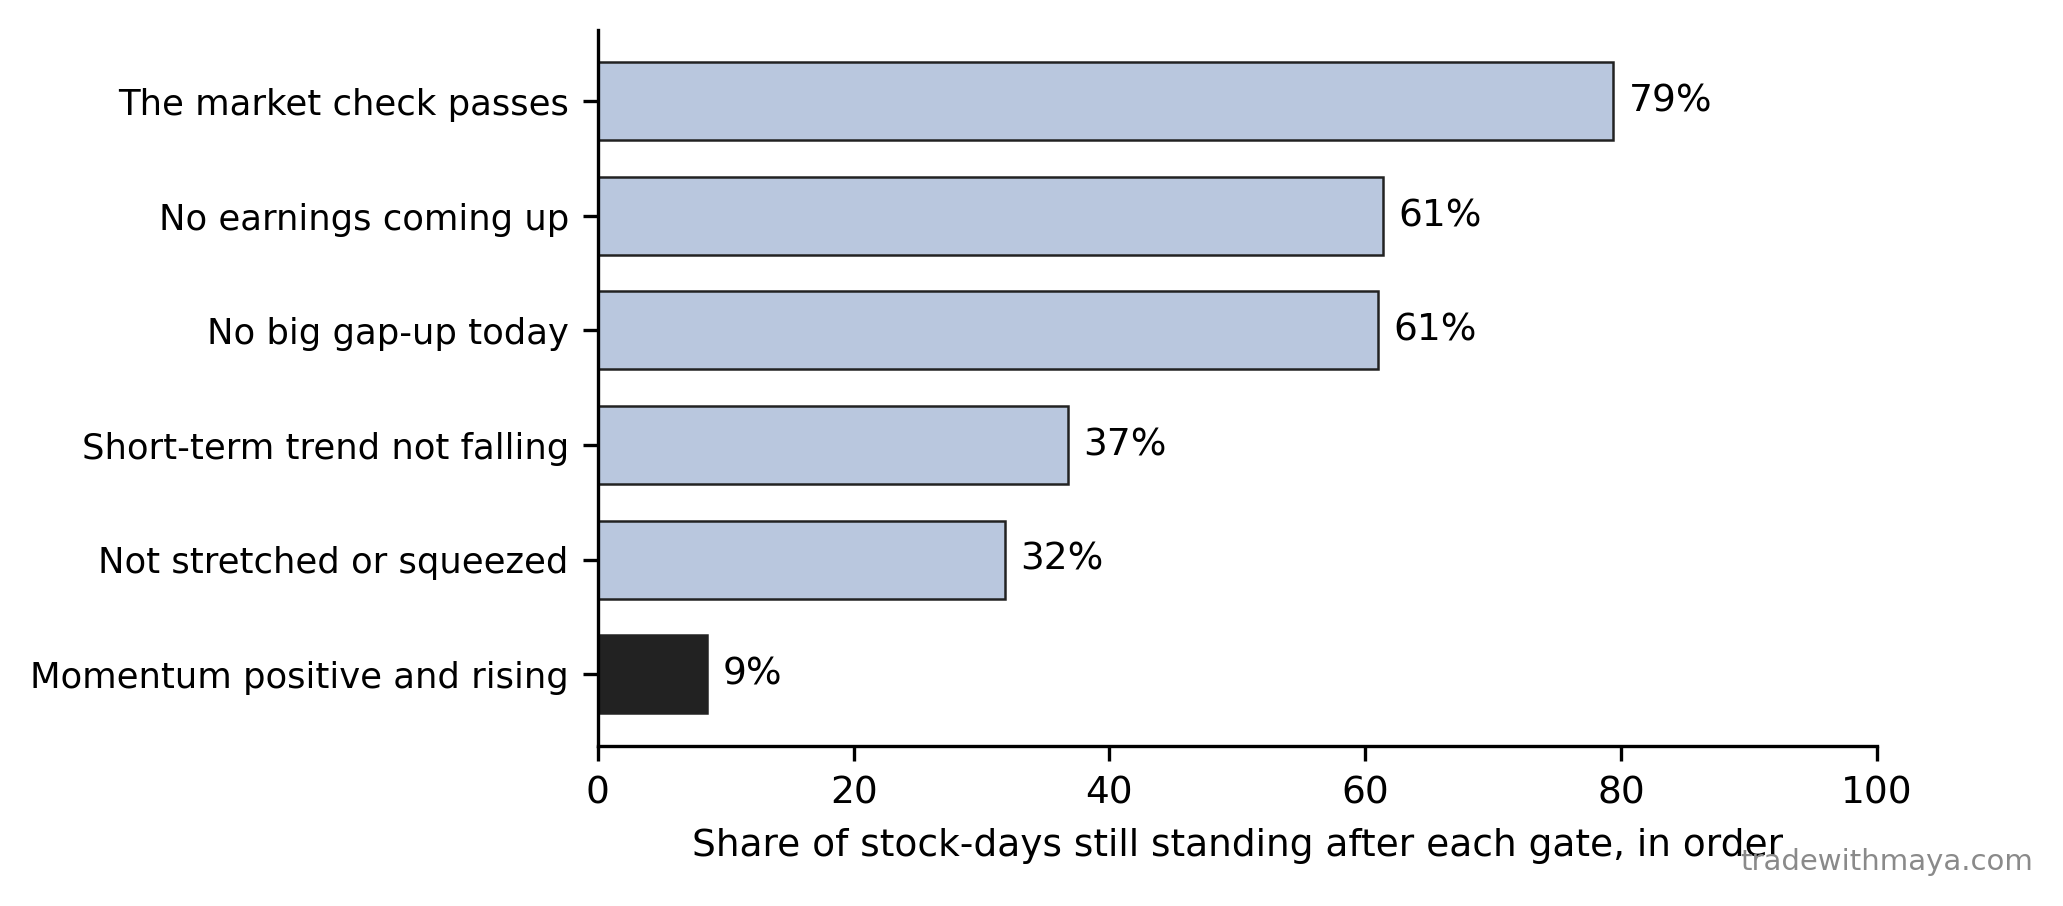
The share of stock-days still standing after each gate, 2019 through 2024.
The share of stock-days still standing after each gate, 2019 through 2024. Download full size
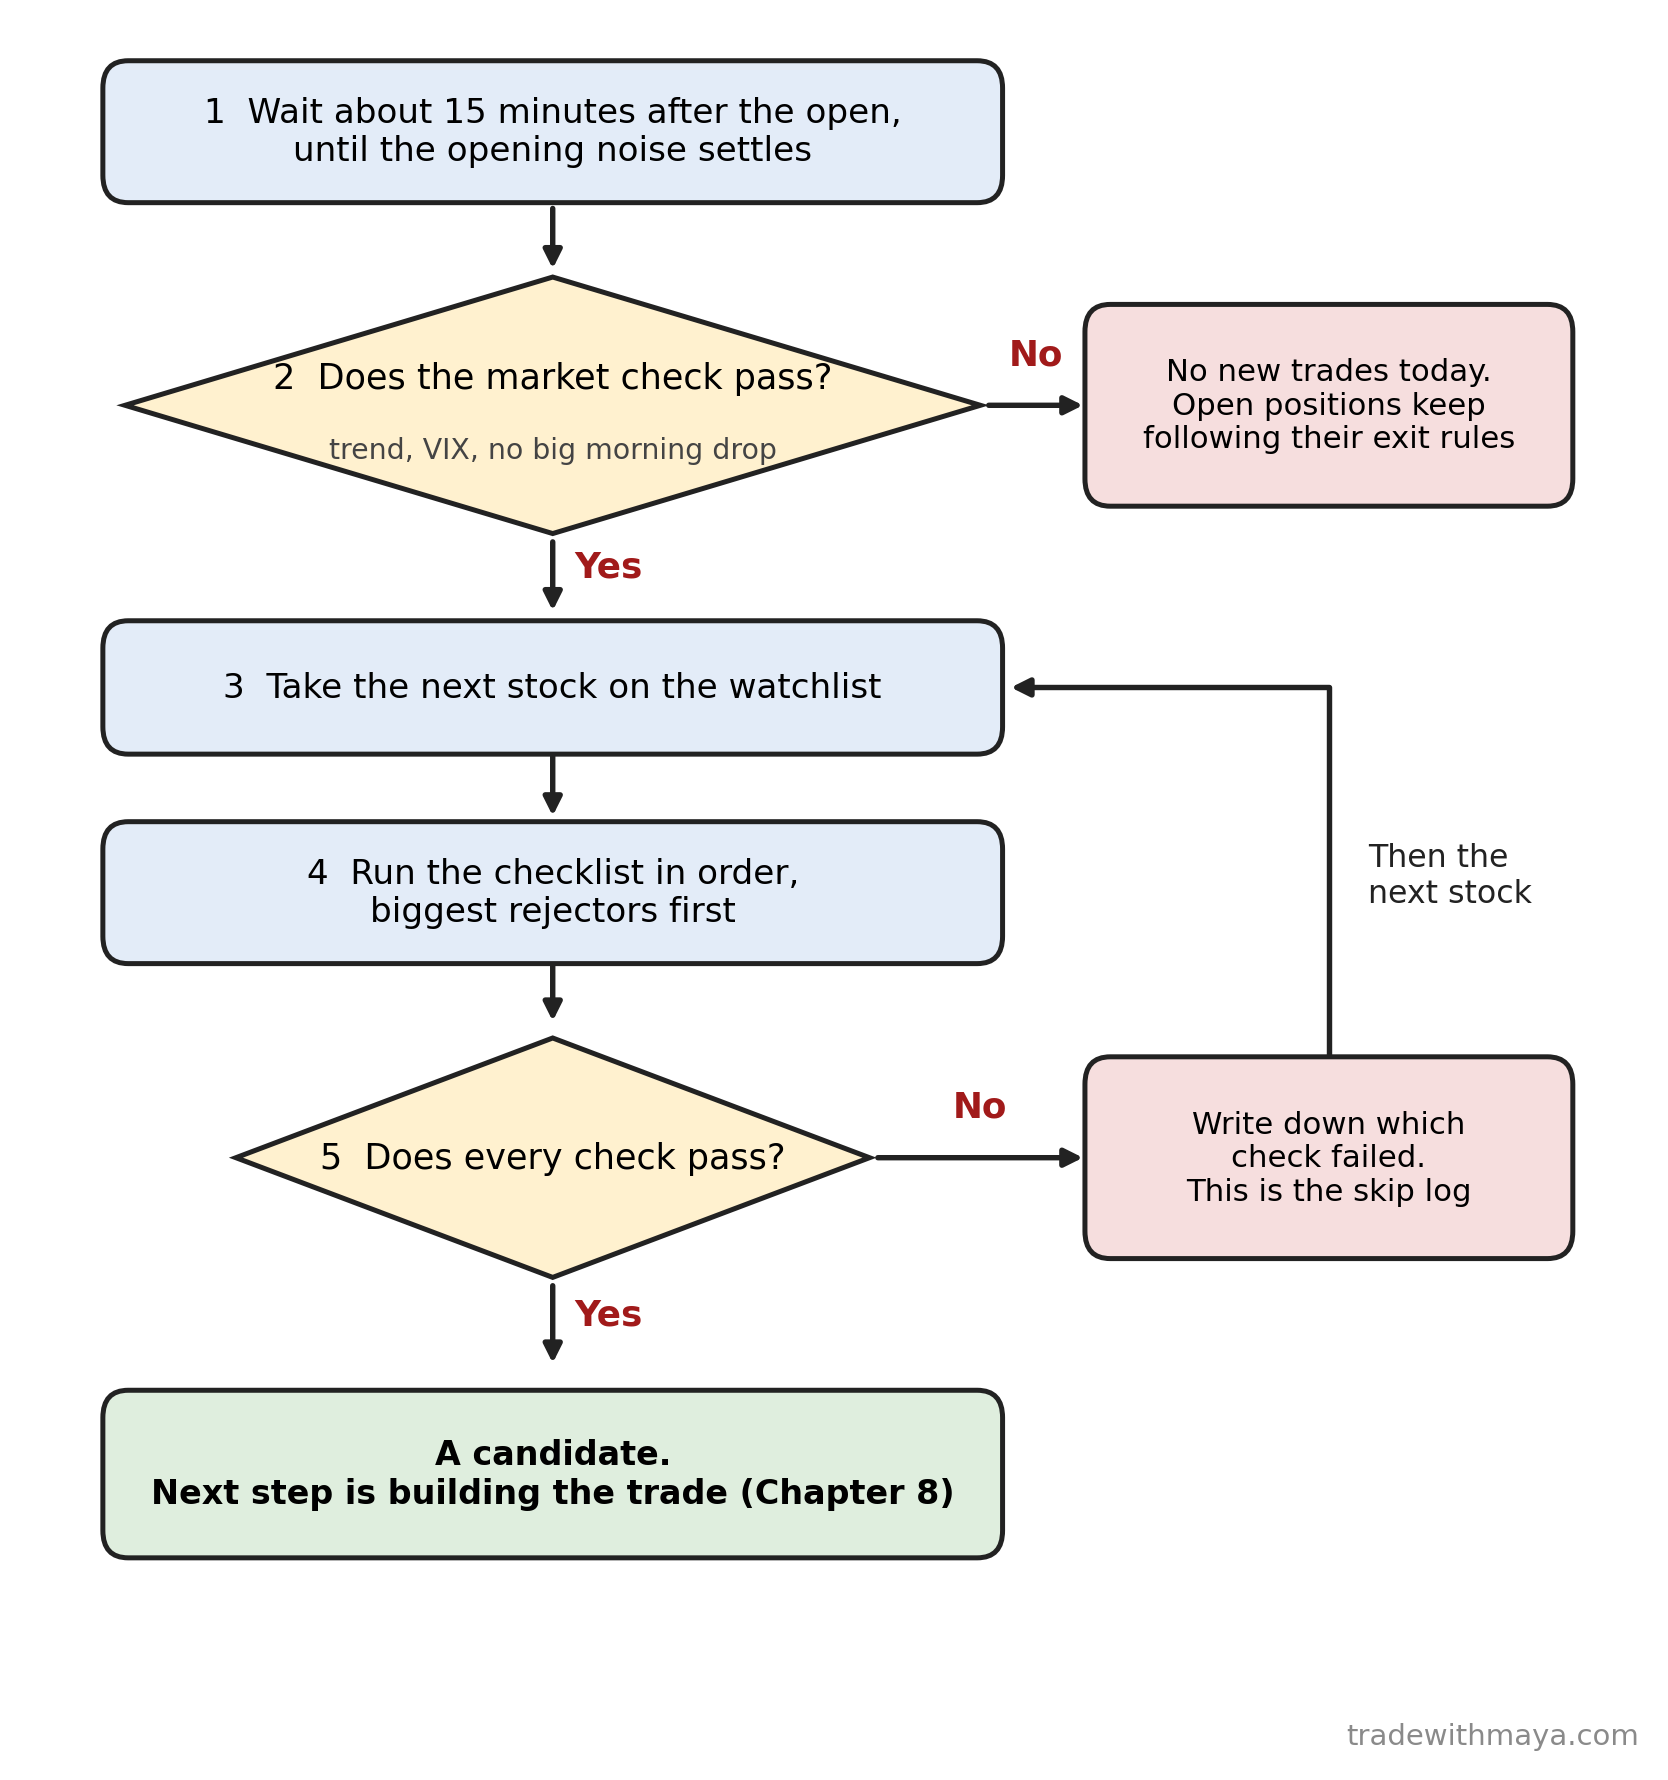
The daily routine on one page.
The daily routine on one page. Download full size
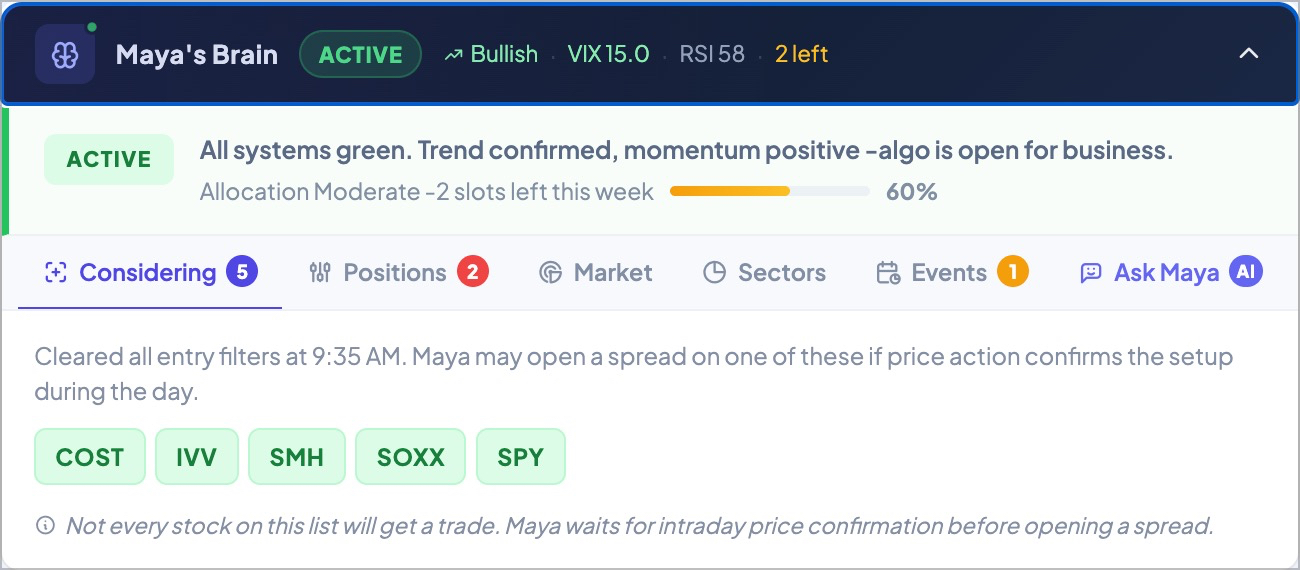
A screenshot of Maya's own dashboard mid-routine: active, bullish, a handful of candidates that cleared the entry filters, waiting on intraday price confirmation before anything actually opens.
A screenshot of Maya's own dashboard mid-routine: active, bullish, a handful of candidates that cleared the entry filters, waiting on intraday price confirmation before anything actually opens. Download full size

Chapter 9: Five Decisions, One TradeBack to top
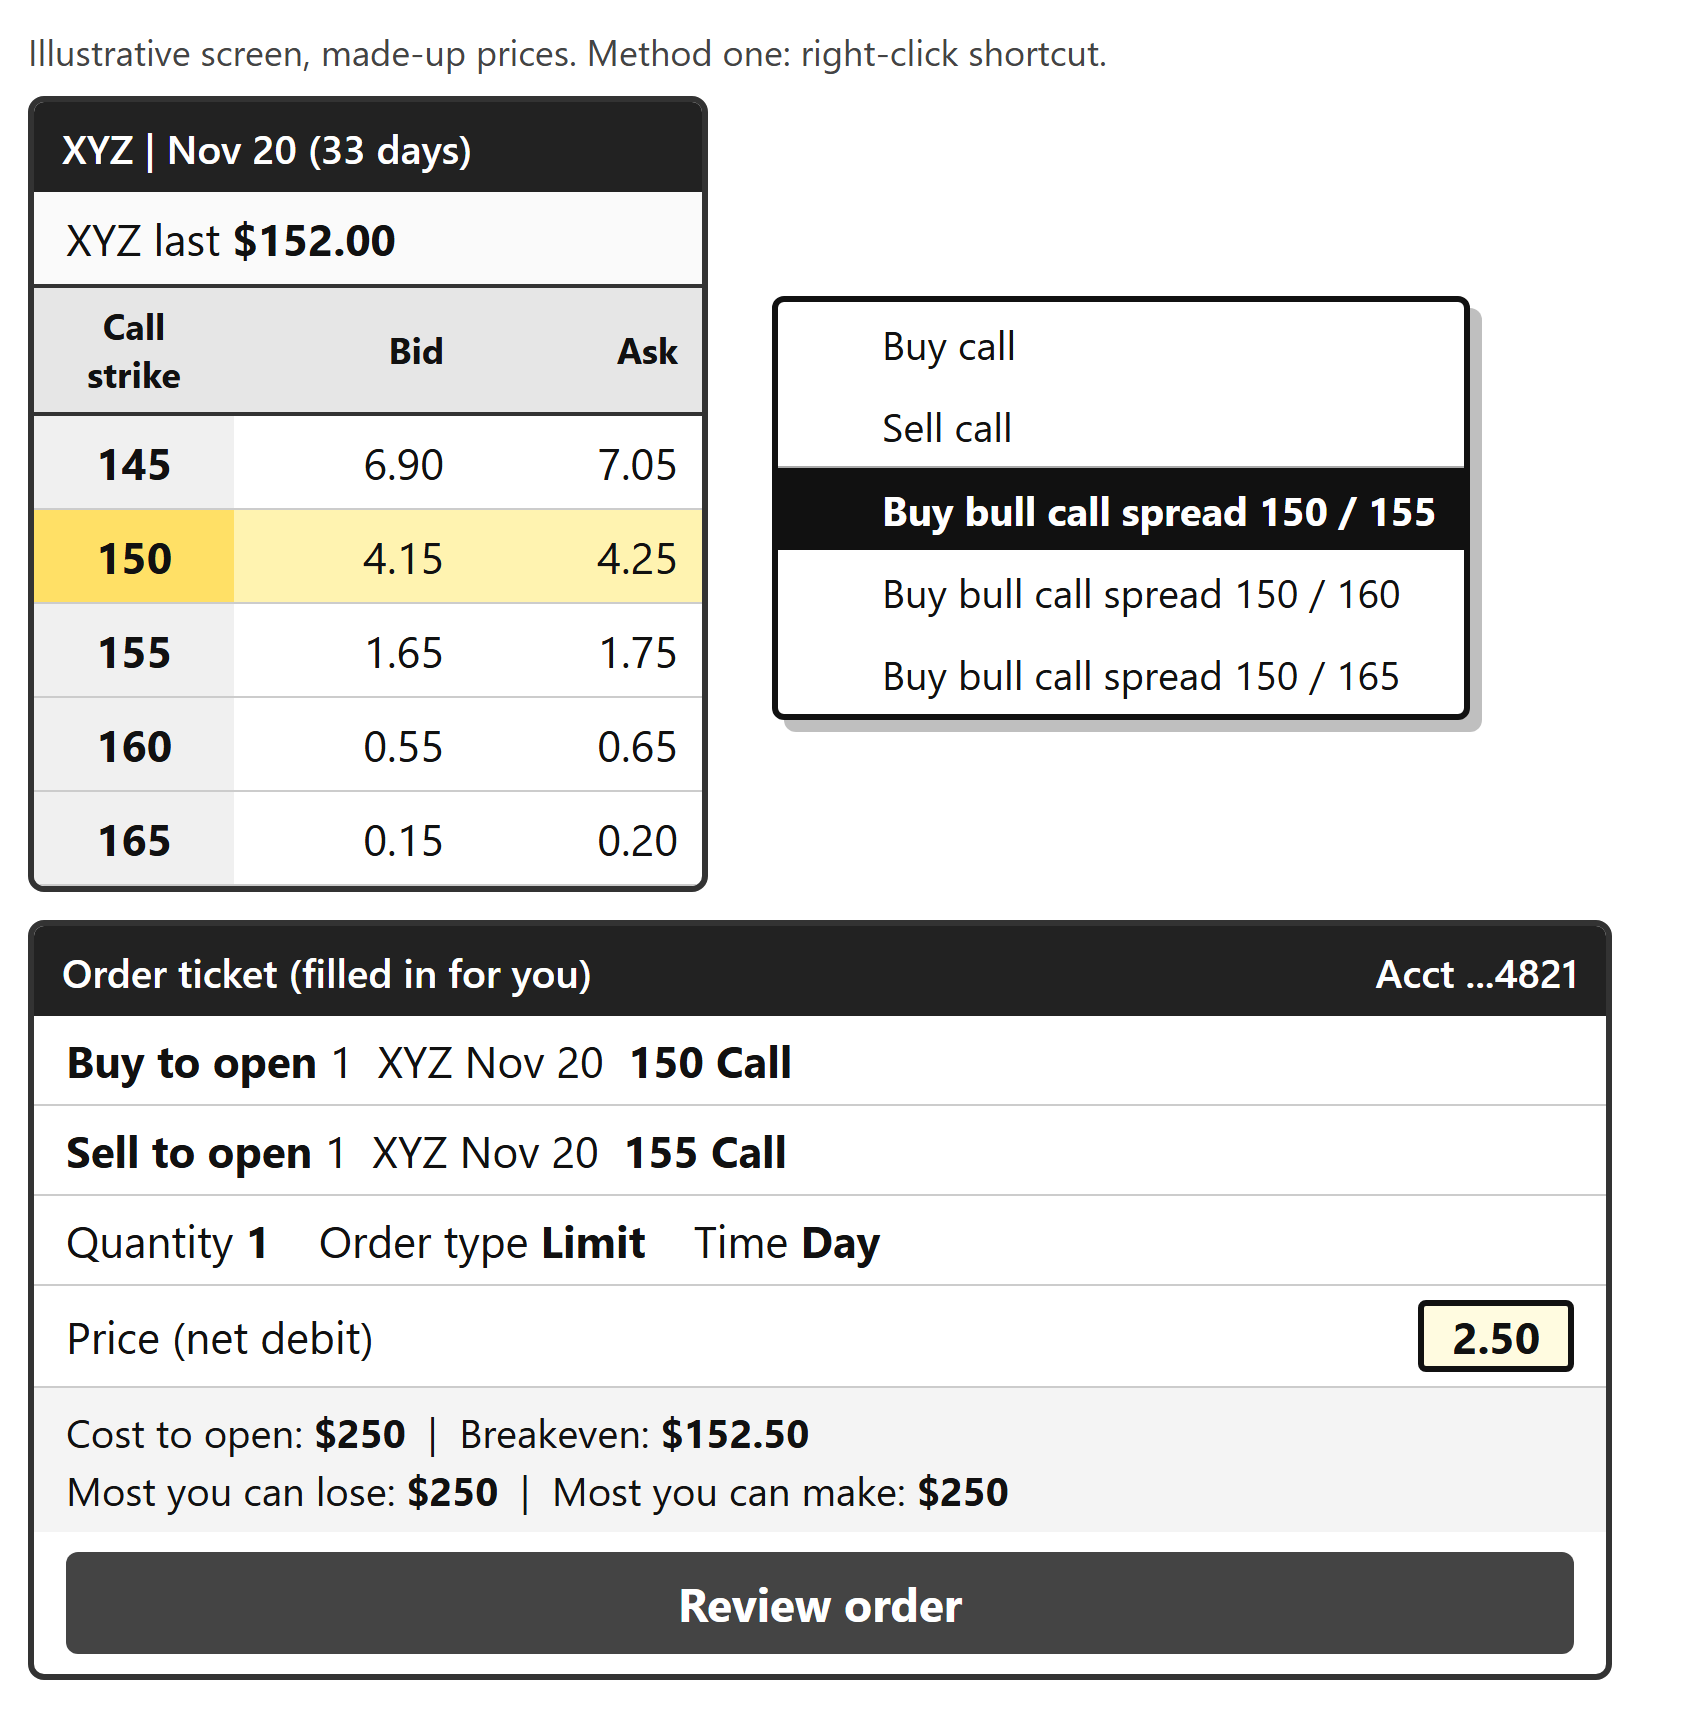
A simulated option chain with a right-click menu on the 150 strike offering a bull call spread 150 / 155, and the order ticket it fills in with a limit price of 2.50.
A simulated option chain with a right-click menu on the 150 strike offering a bull call spread 150 / 155, and the order ticket it fills in with a limit price of 2.50. Download full size
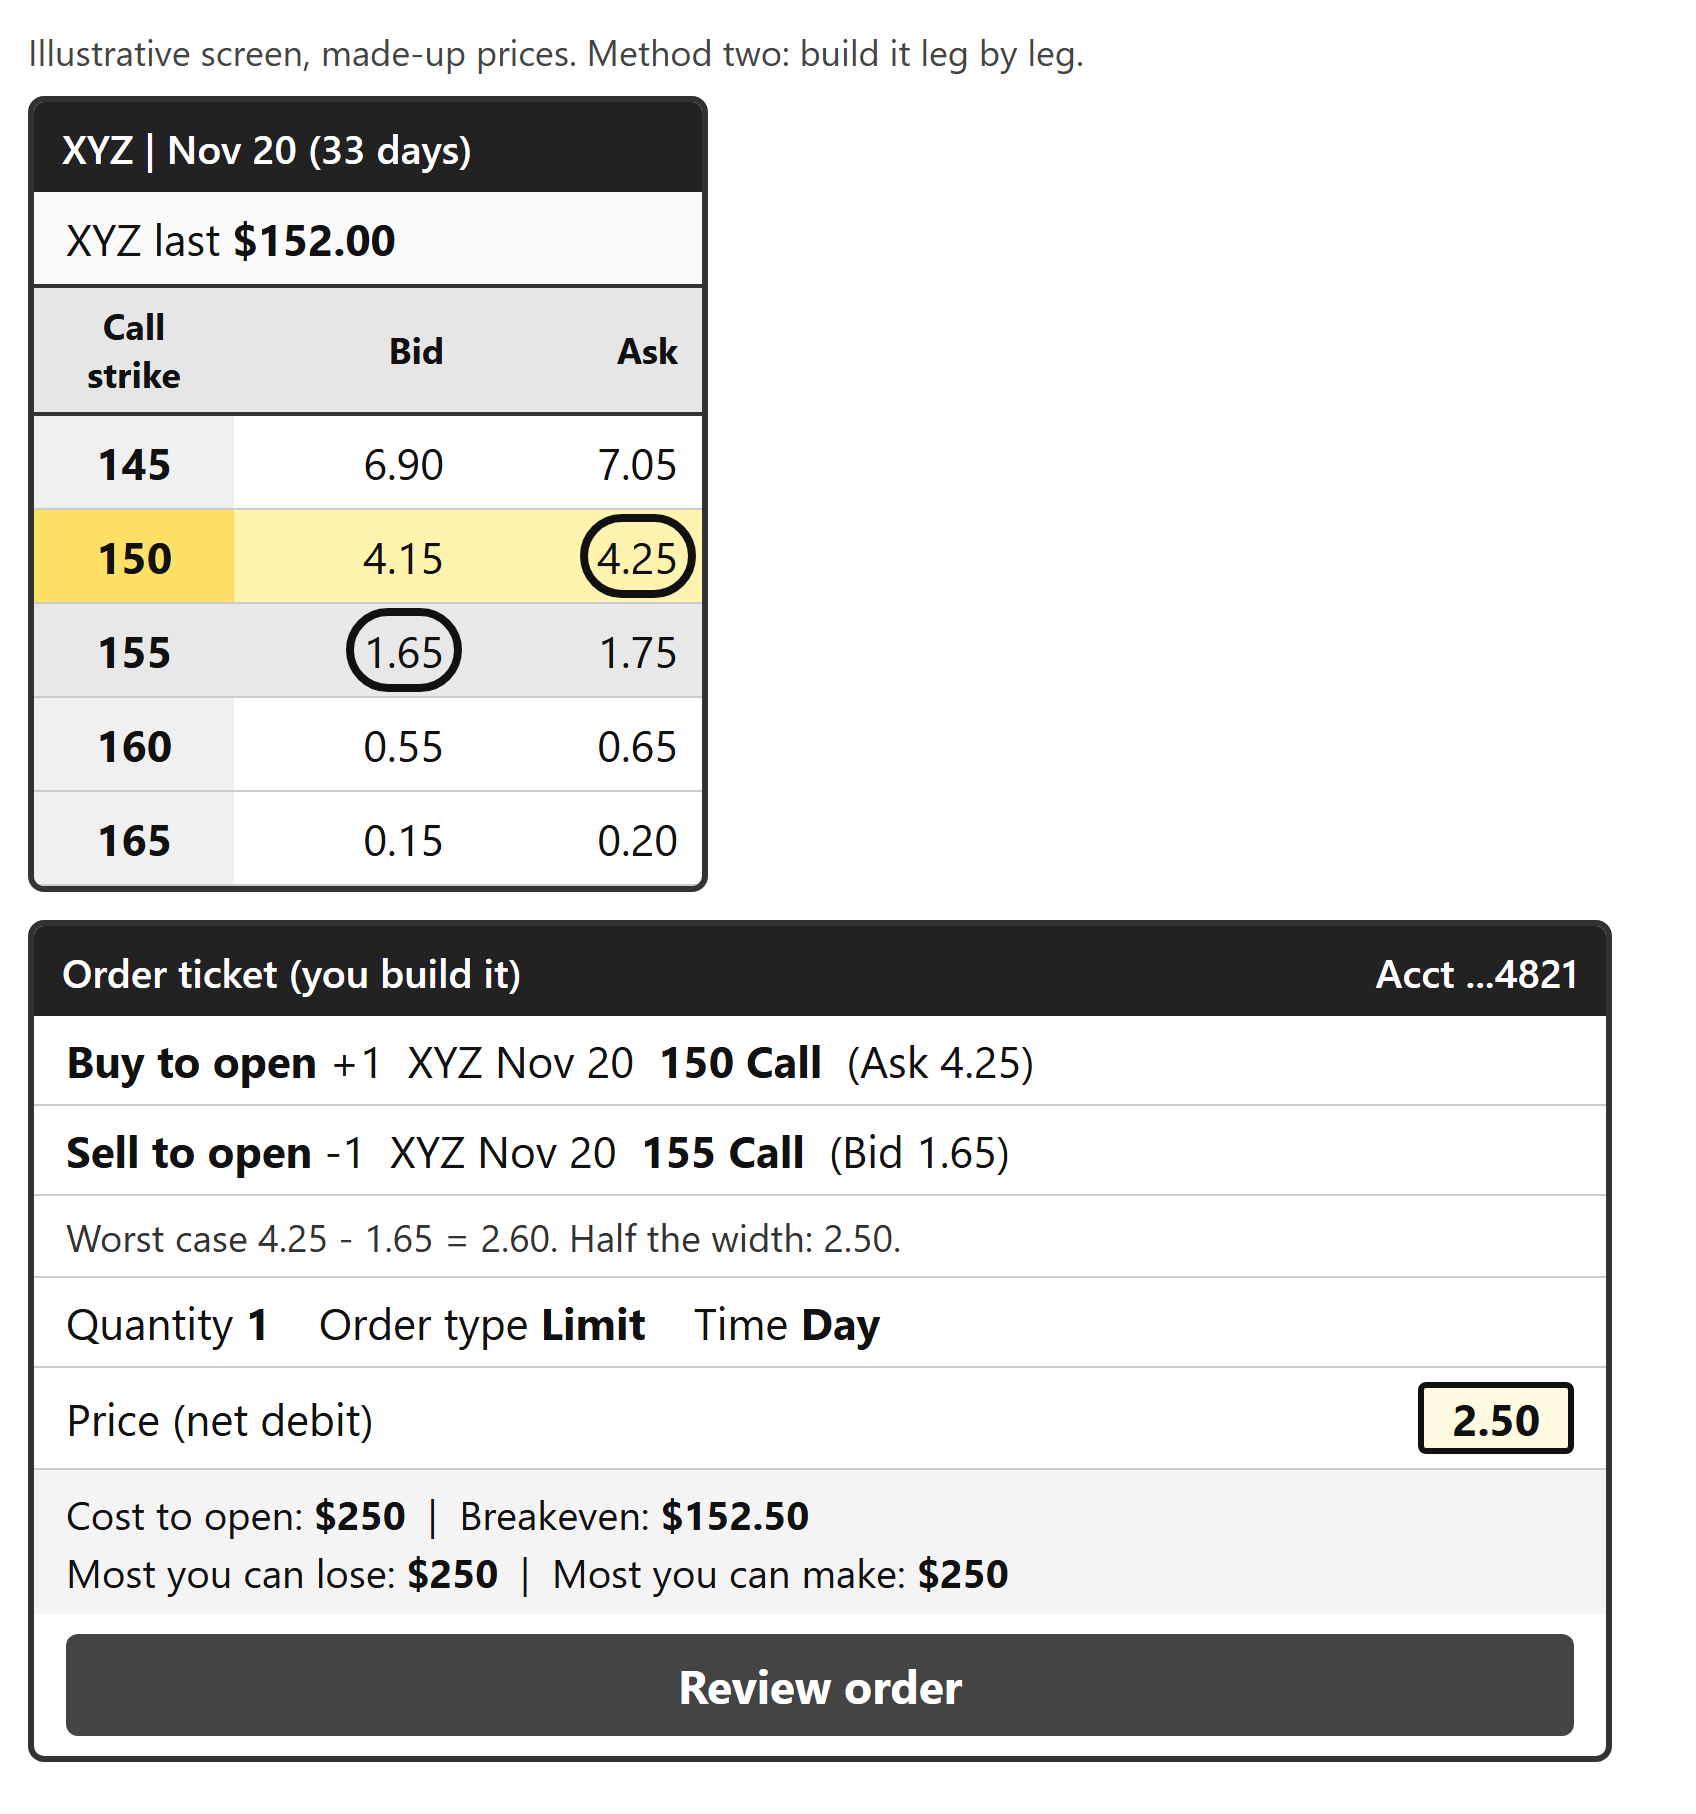
A simulated order ticket built by hand: buy to open the 150 call, sell to open the 155 call, one order, limit 2.50,
A simulated order ticket built by hand: buy to open the 150 call, sell to open the 155 call, one order, limit 2.50, Download full size
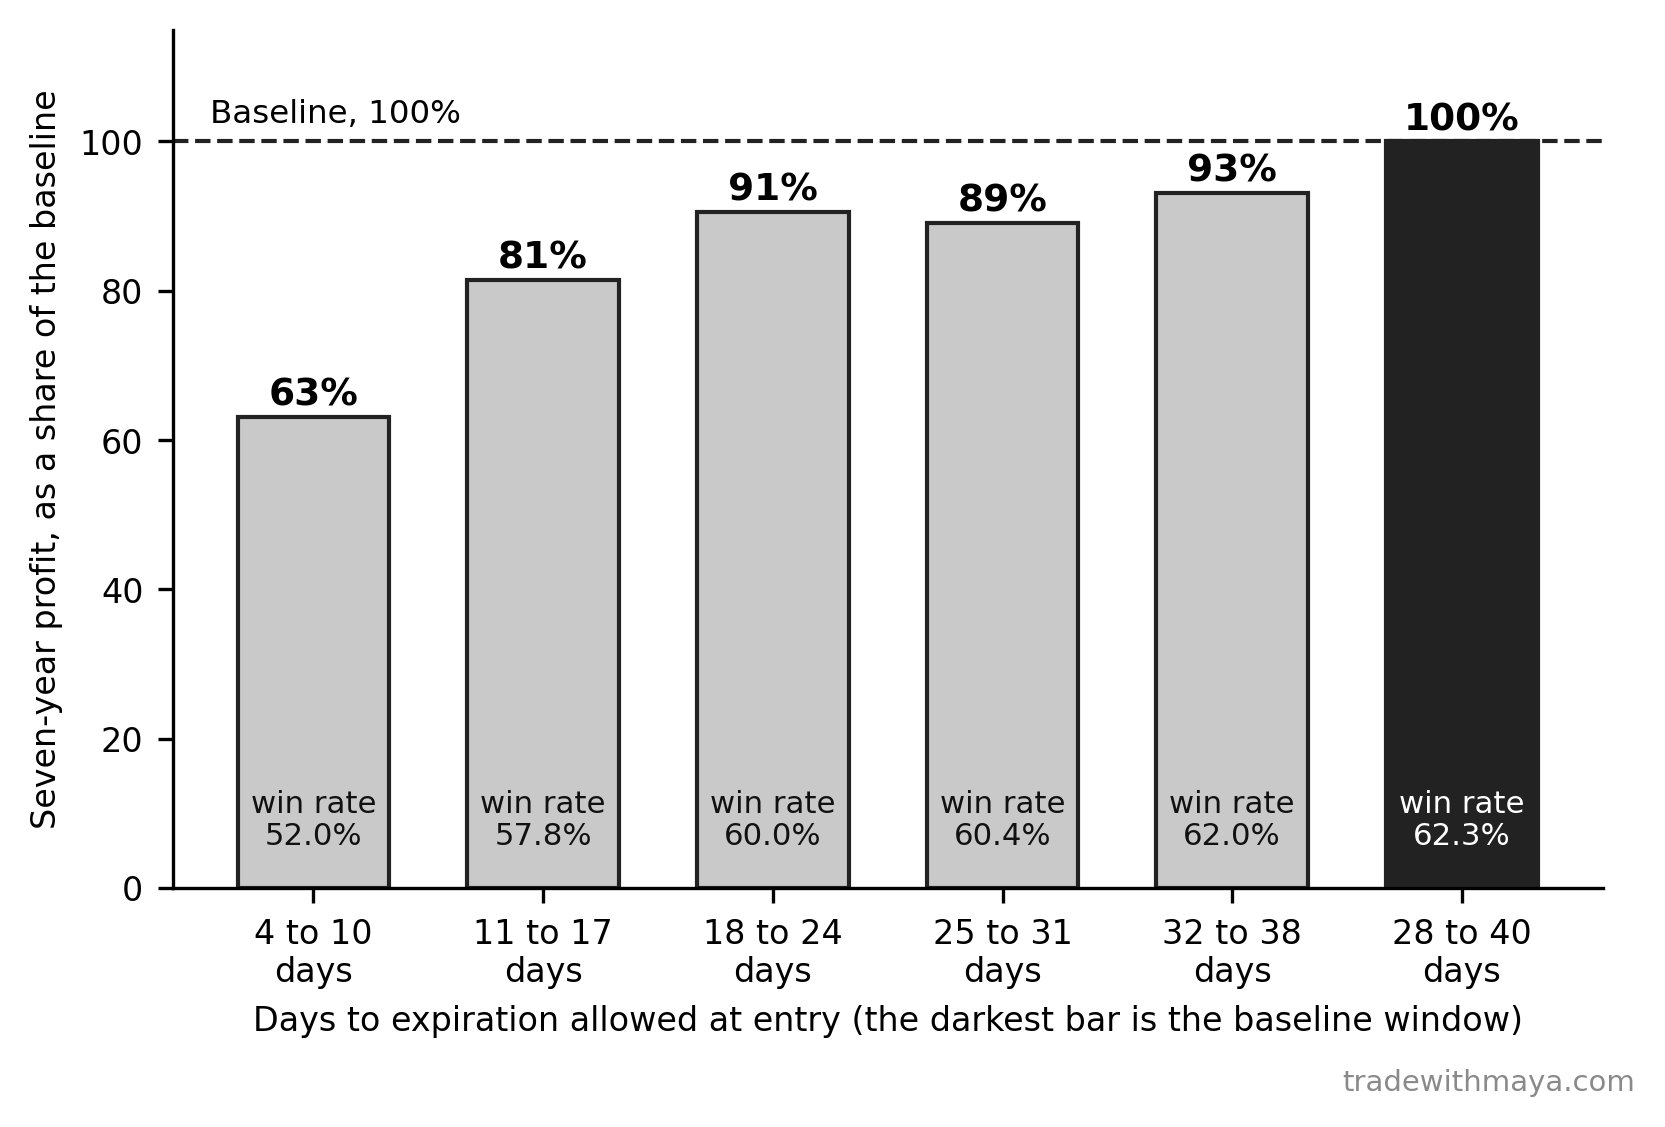
Seven-year profit for six expiration windows, each shown as a share of the 28 to 40 day baseline, with the win rate inside each bar.
Seven-year profit for six expiration windows, each shown as a share of the 28 to 40 day baseline, with the win rate inside each bar. Download full size
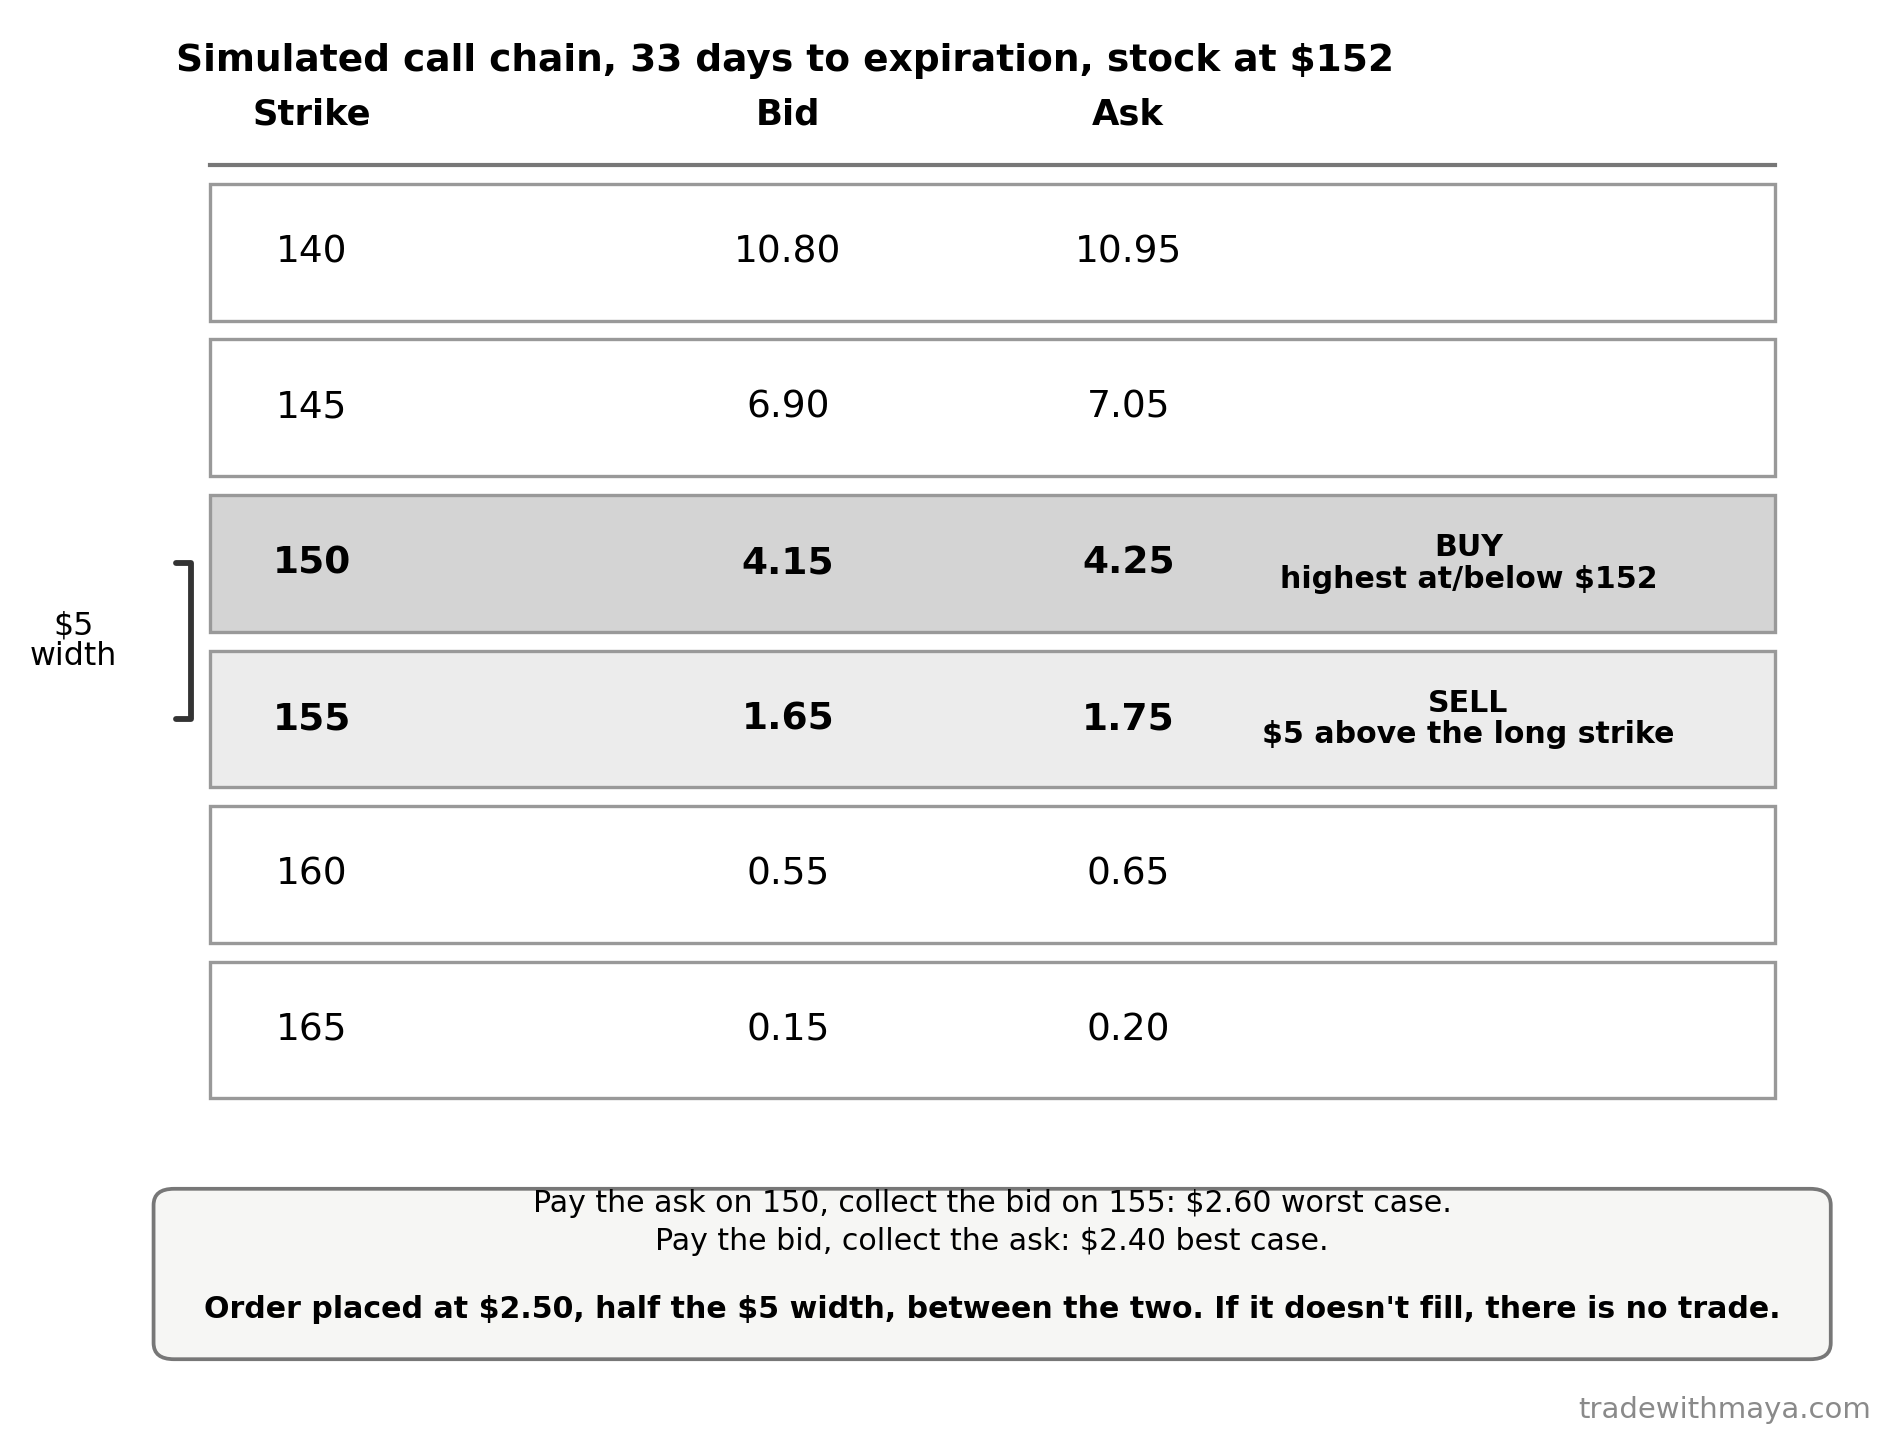
A simulated call option chain, stock at $152, 33 days to expiration.
A simulated call option chain, stock at $152, 33 days to expiration. Download full size
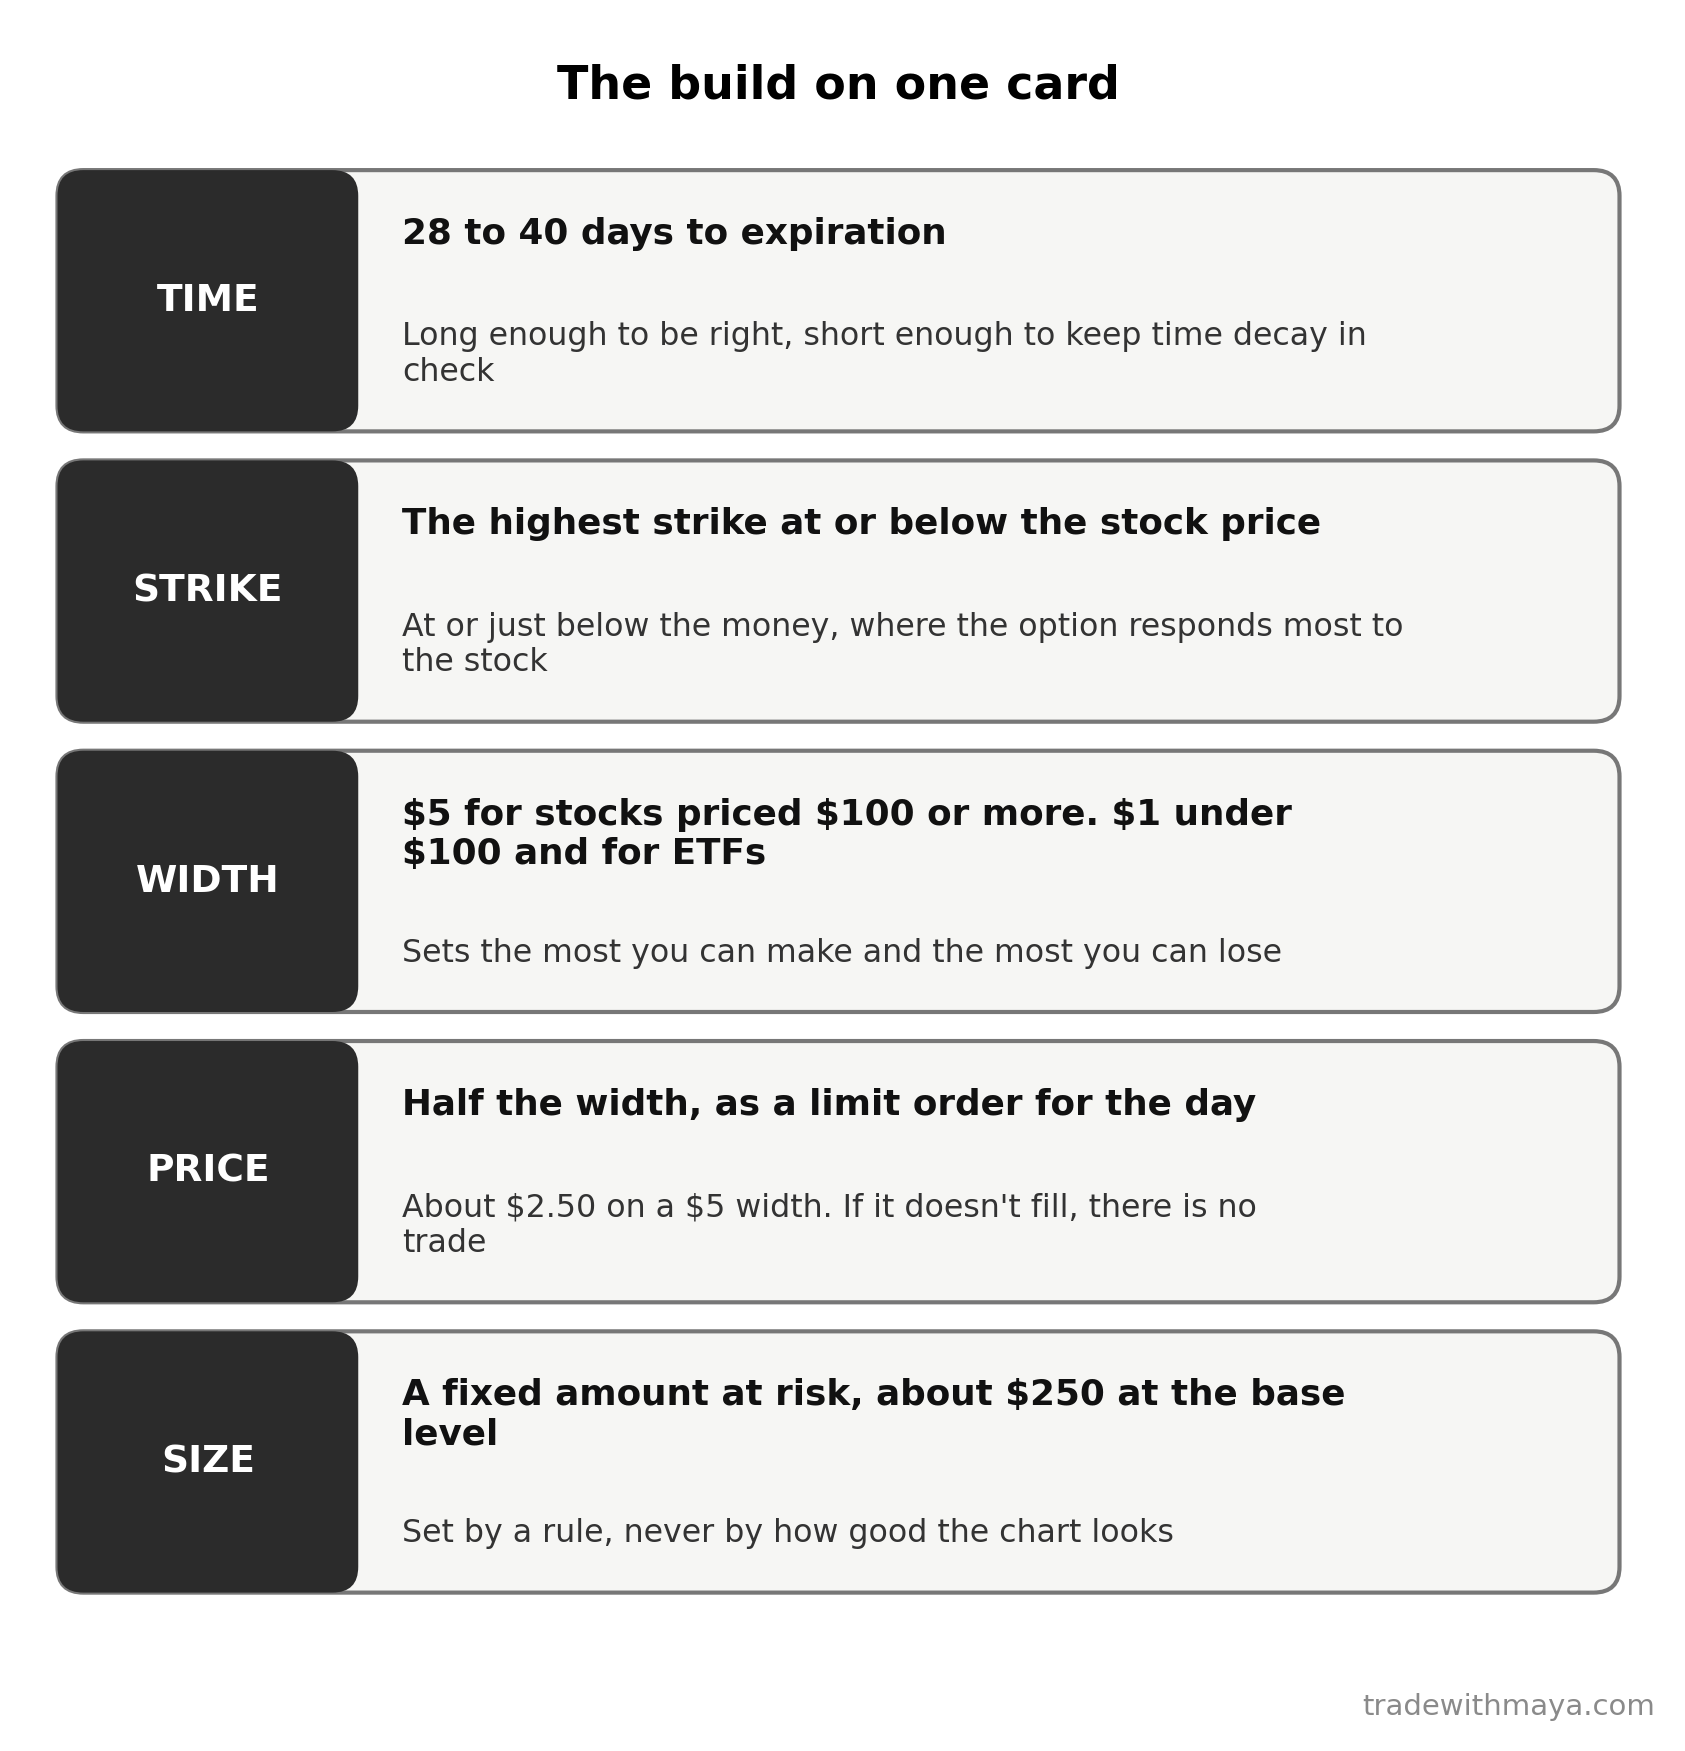
The five build decisions on one card.
The five build decisions on one card. Download full size

Chapter 10: Winners and Losers Look Identical at the DoorBack to top
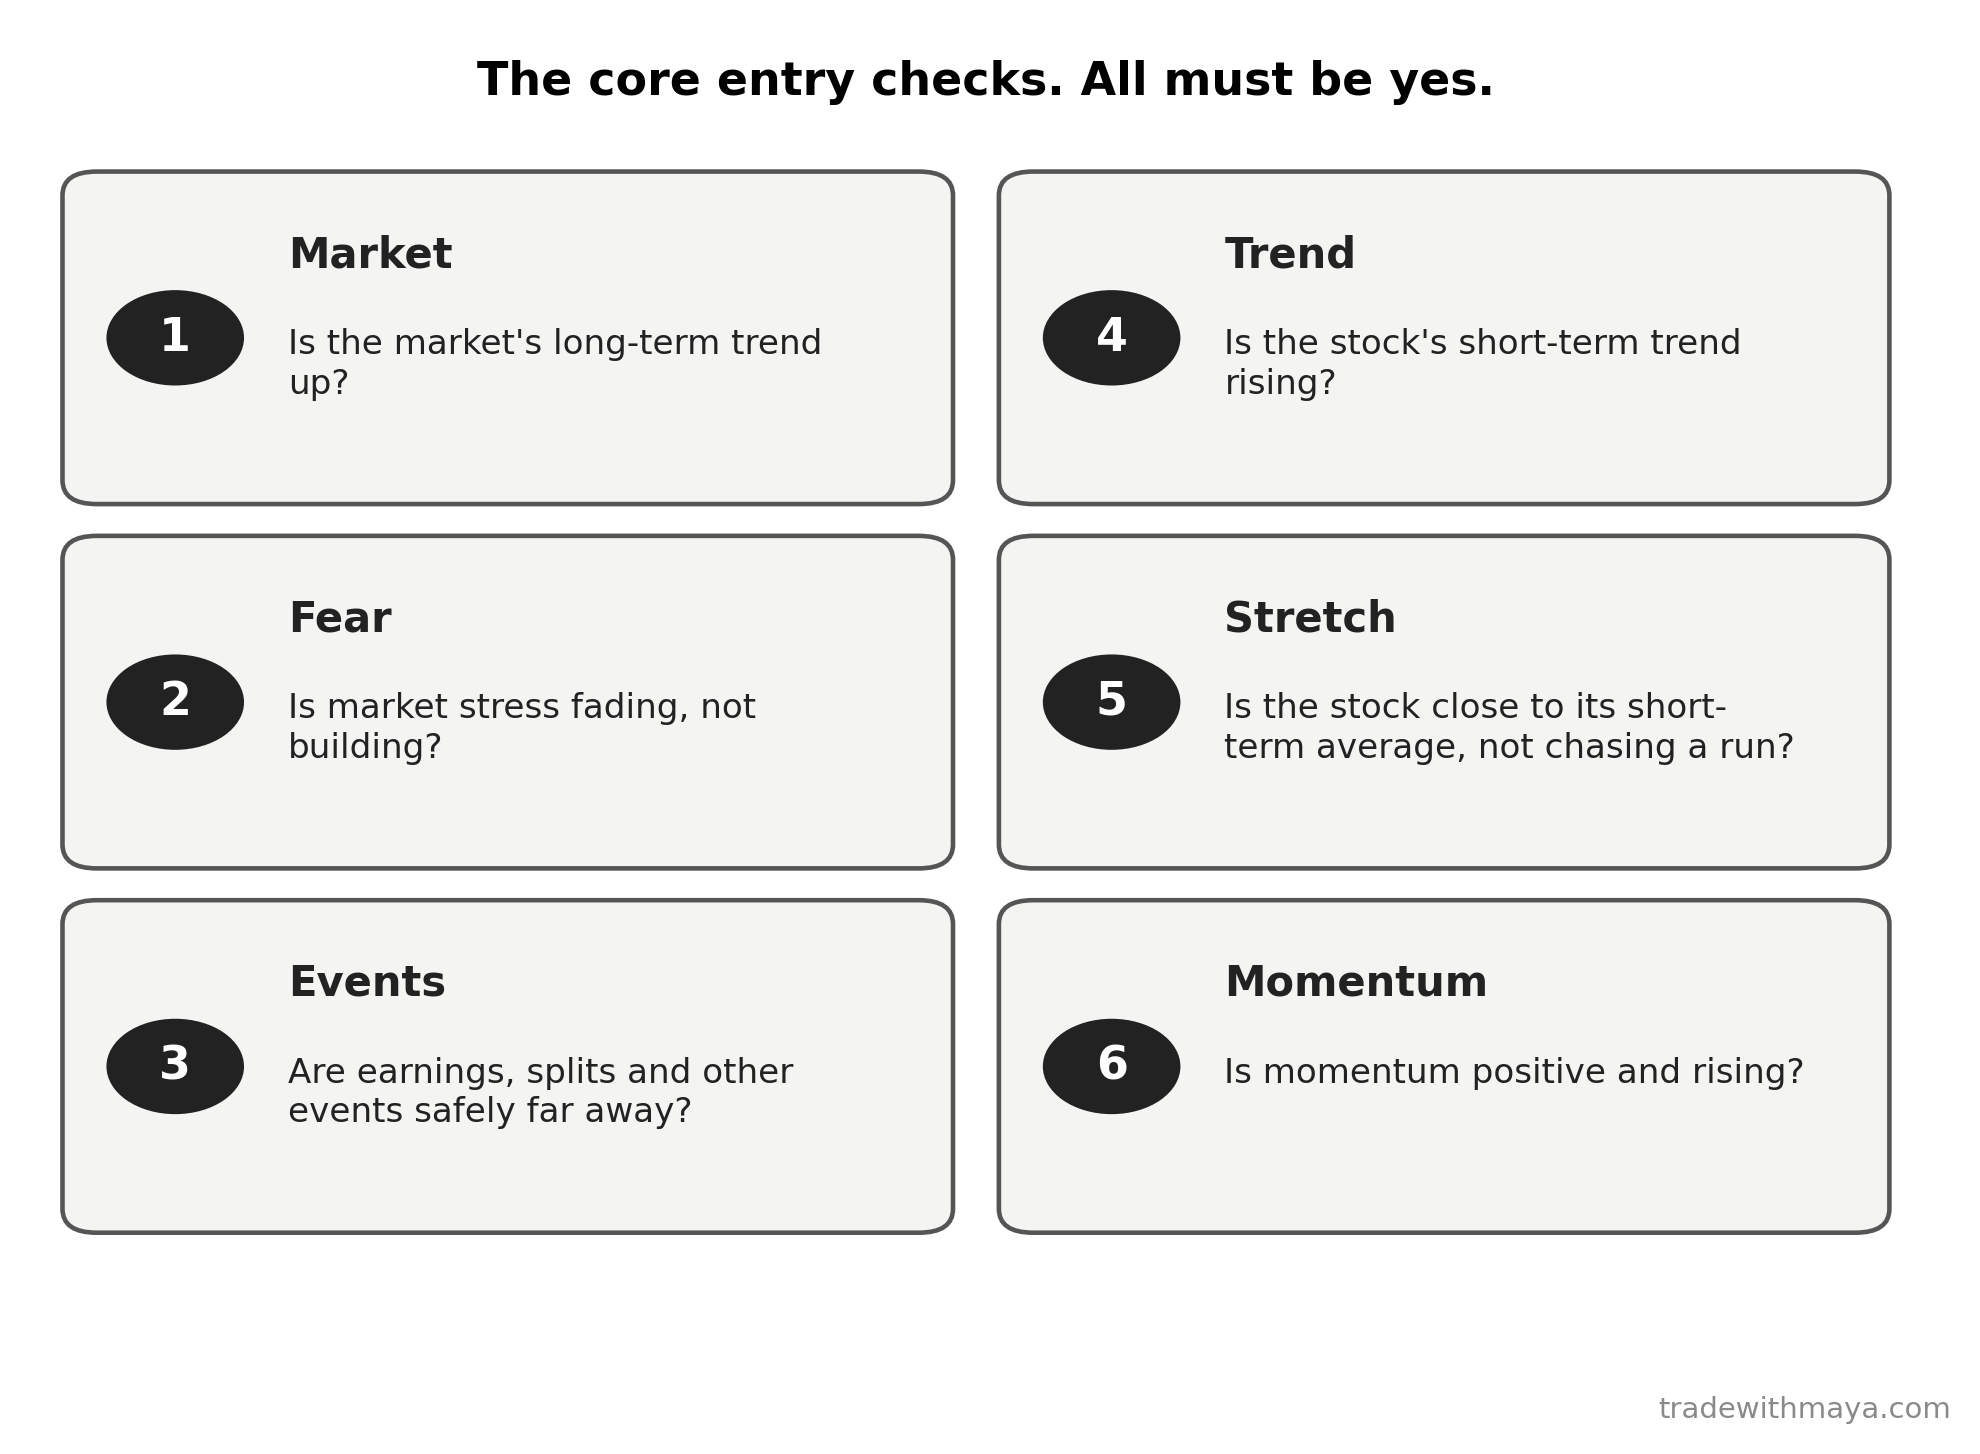
The core entry checks at a glance.
The core entry checks at a glance. Download full size
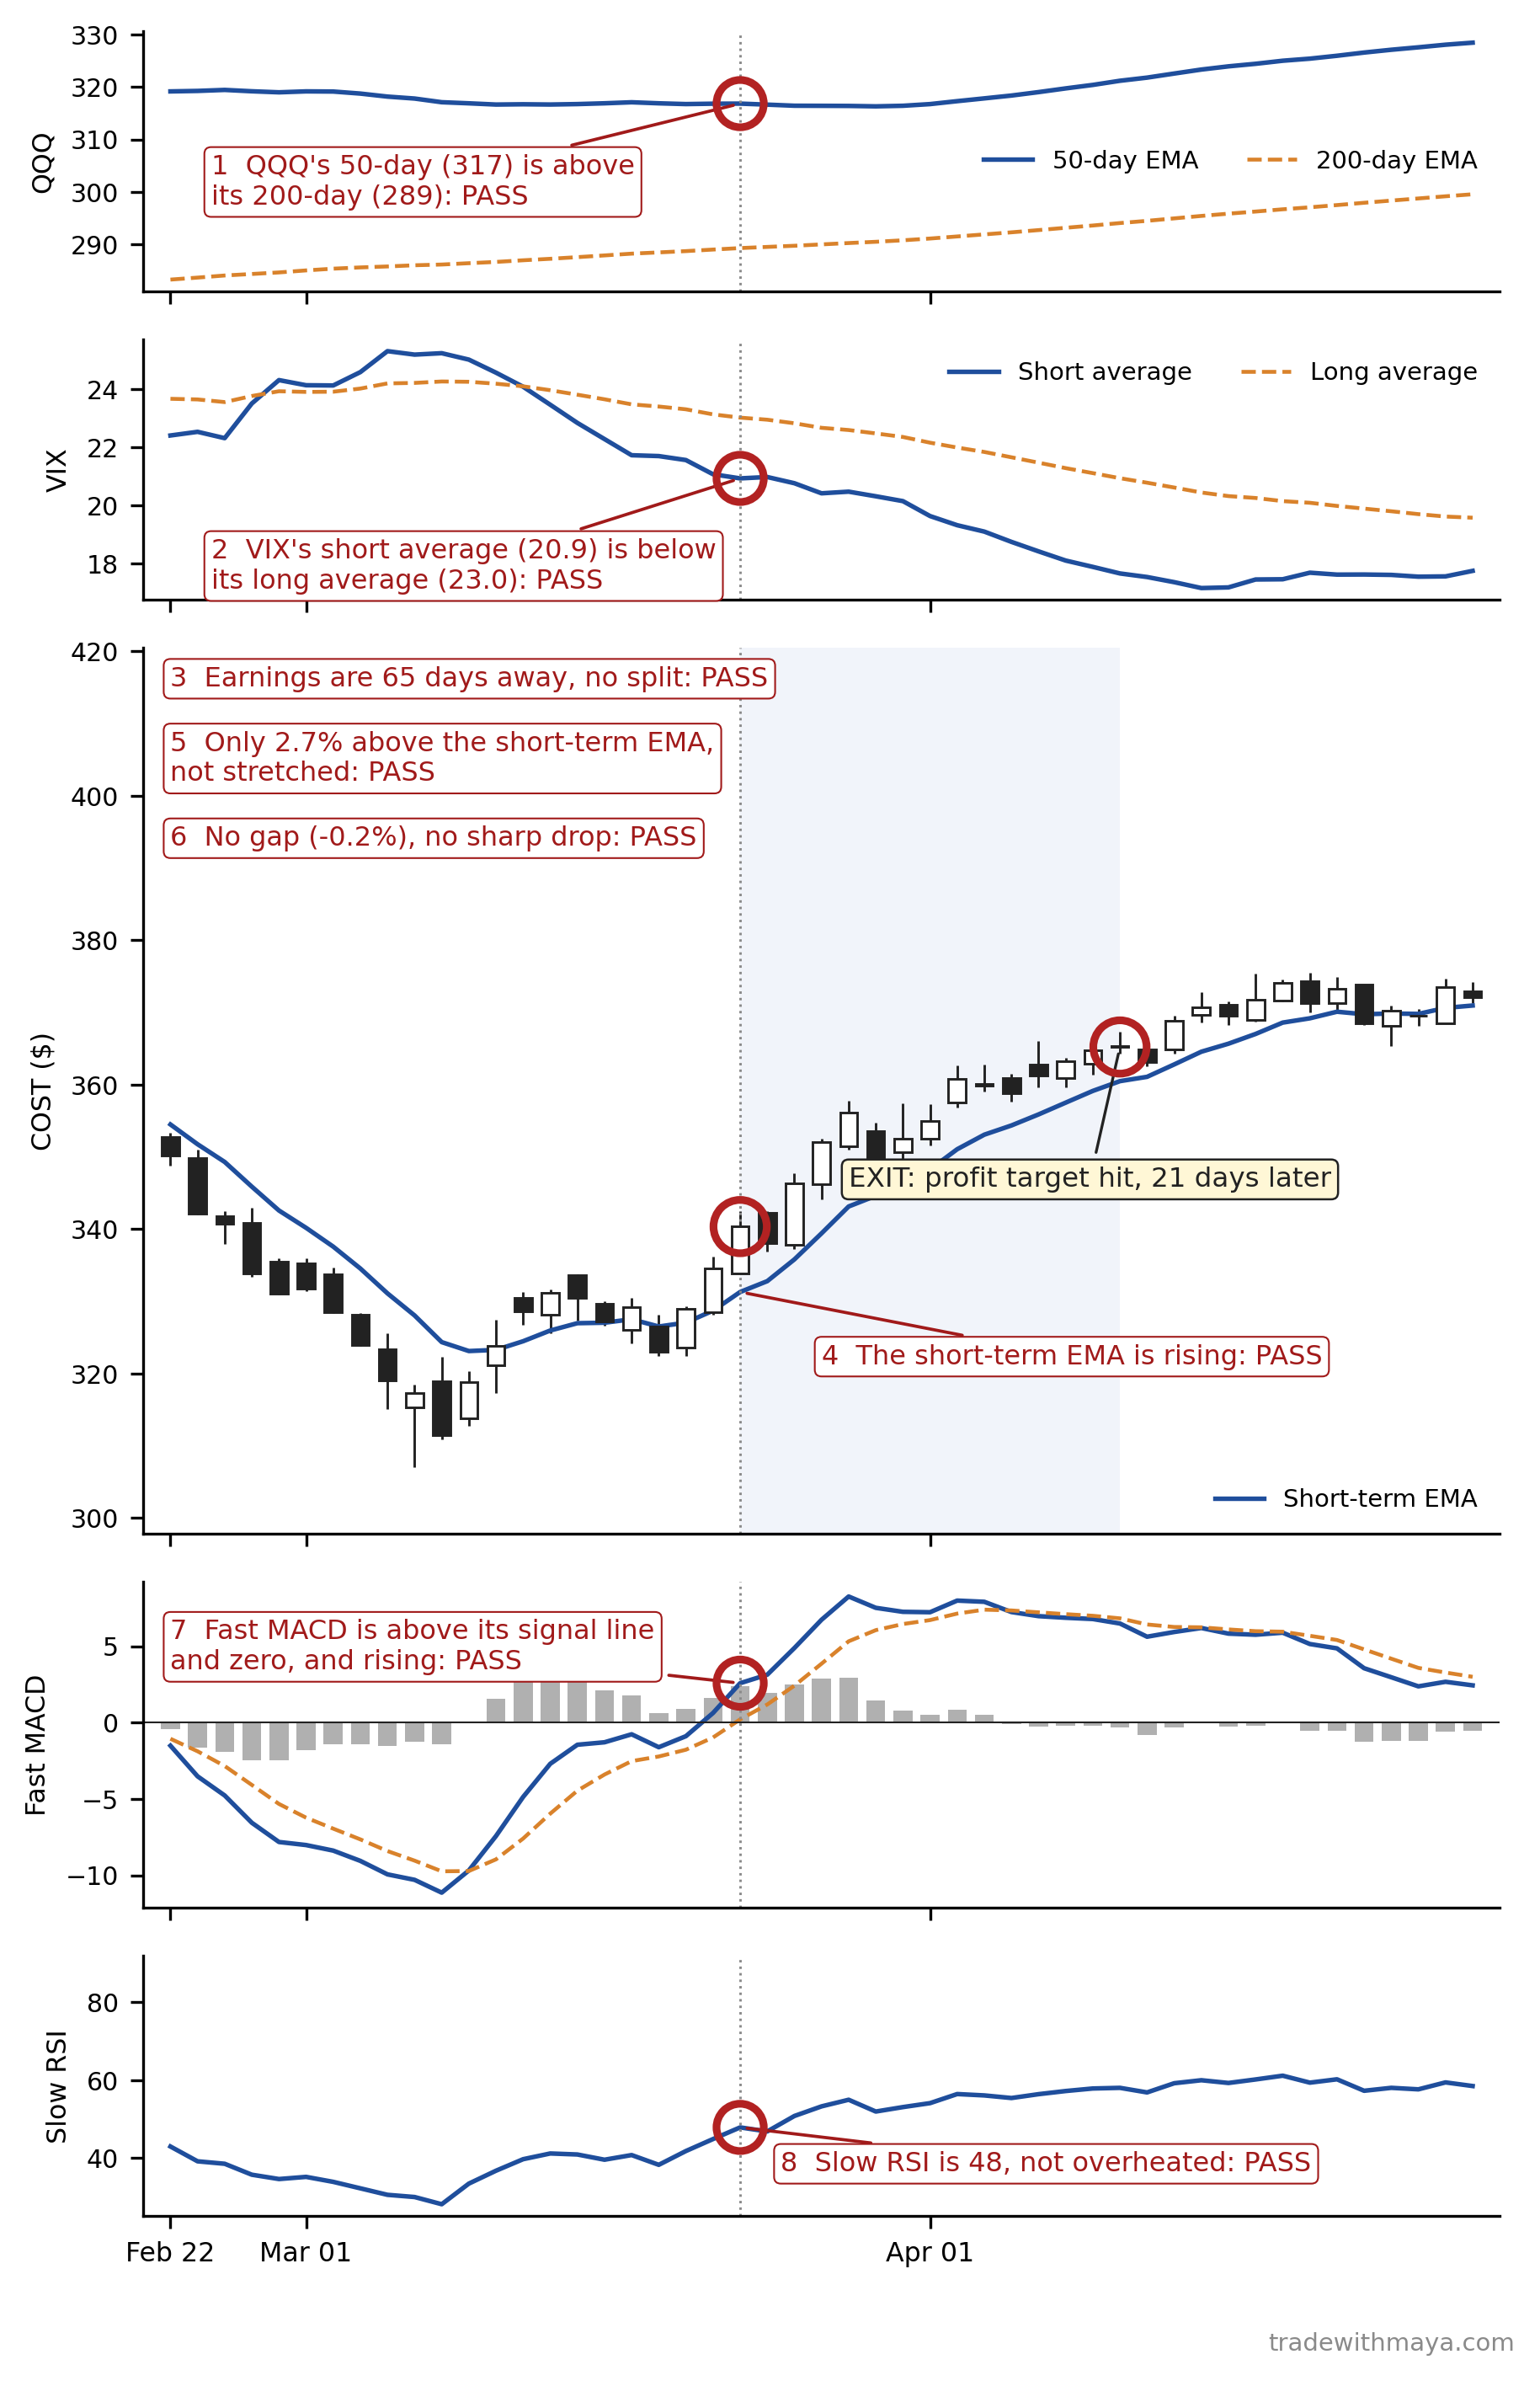
Costco in March and April 2021, the same eight checks drawn on the chart.
Costco in March and April 2021, the same eight checks drawn on the chart. Download full size
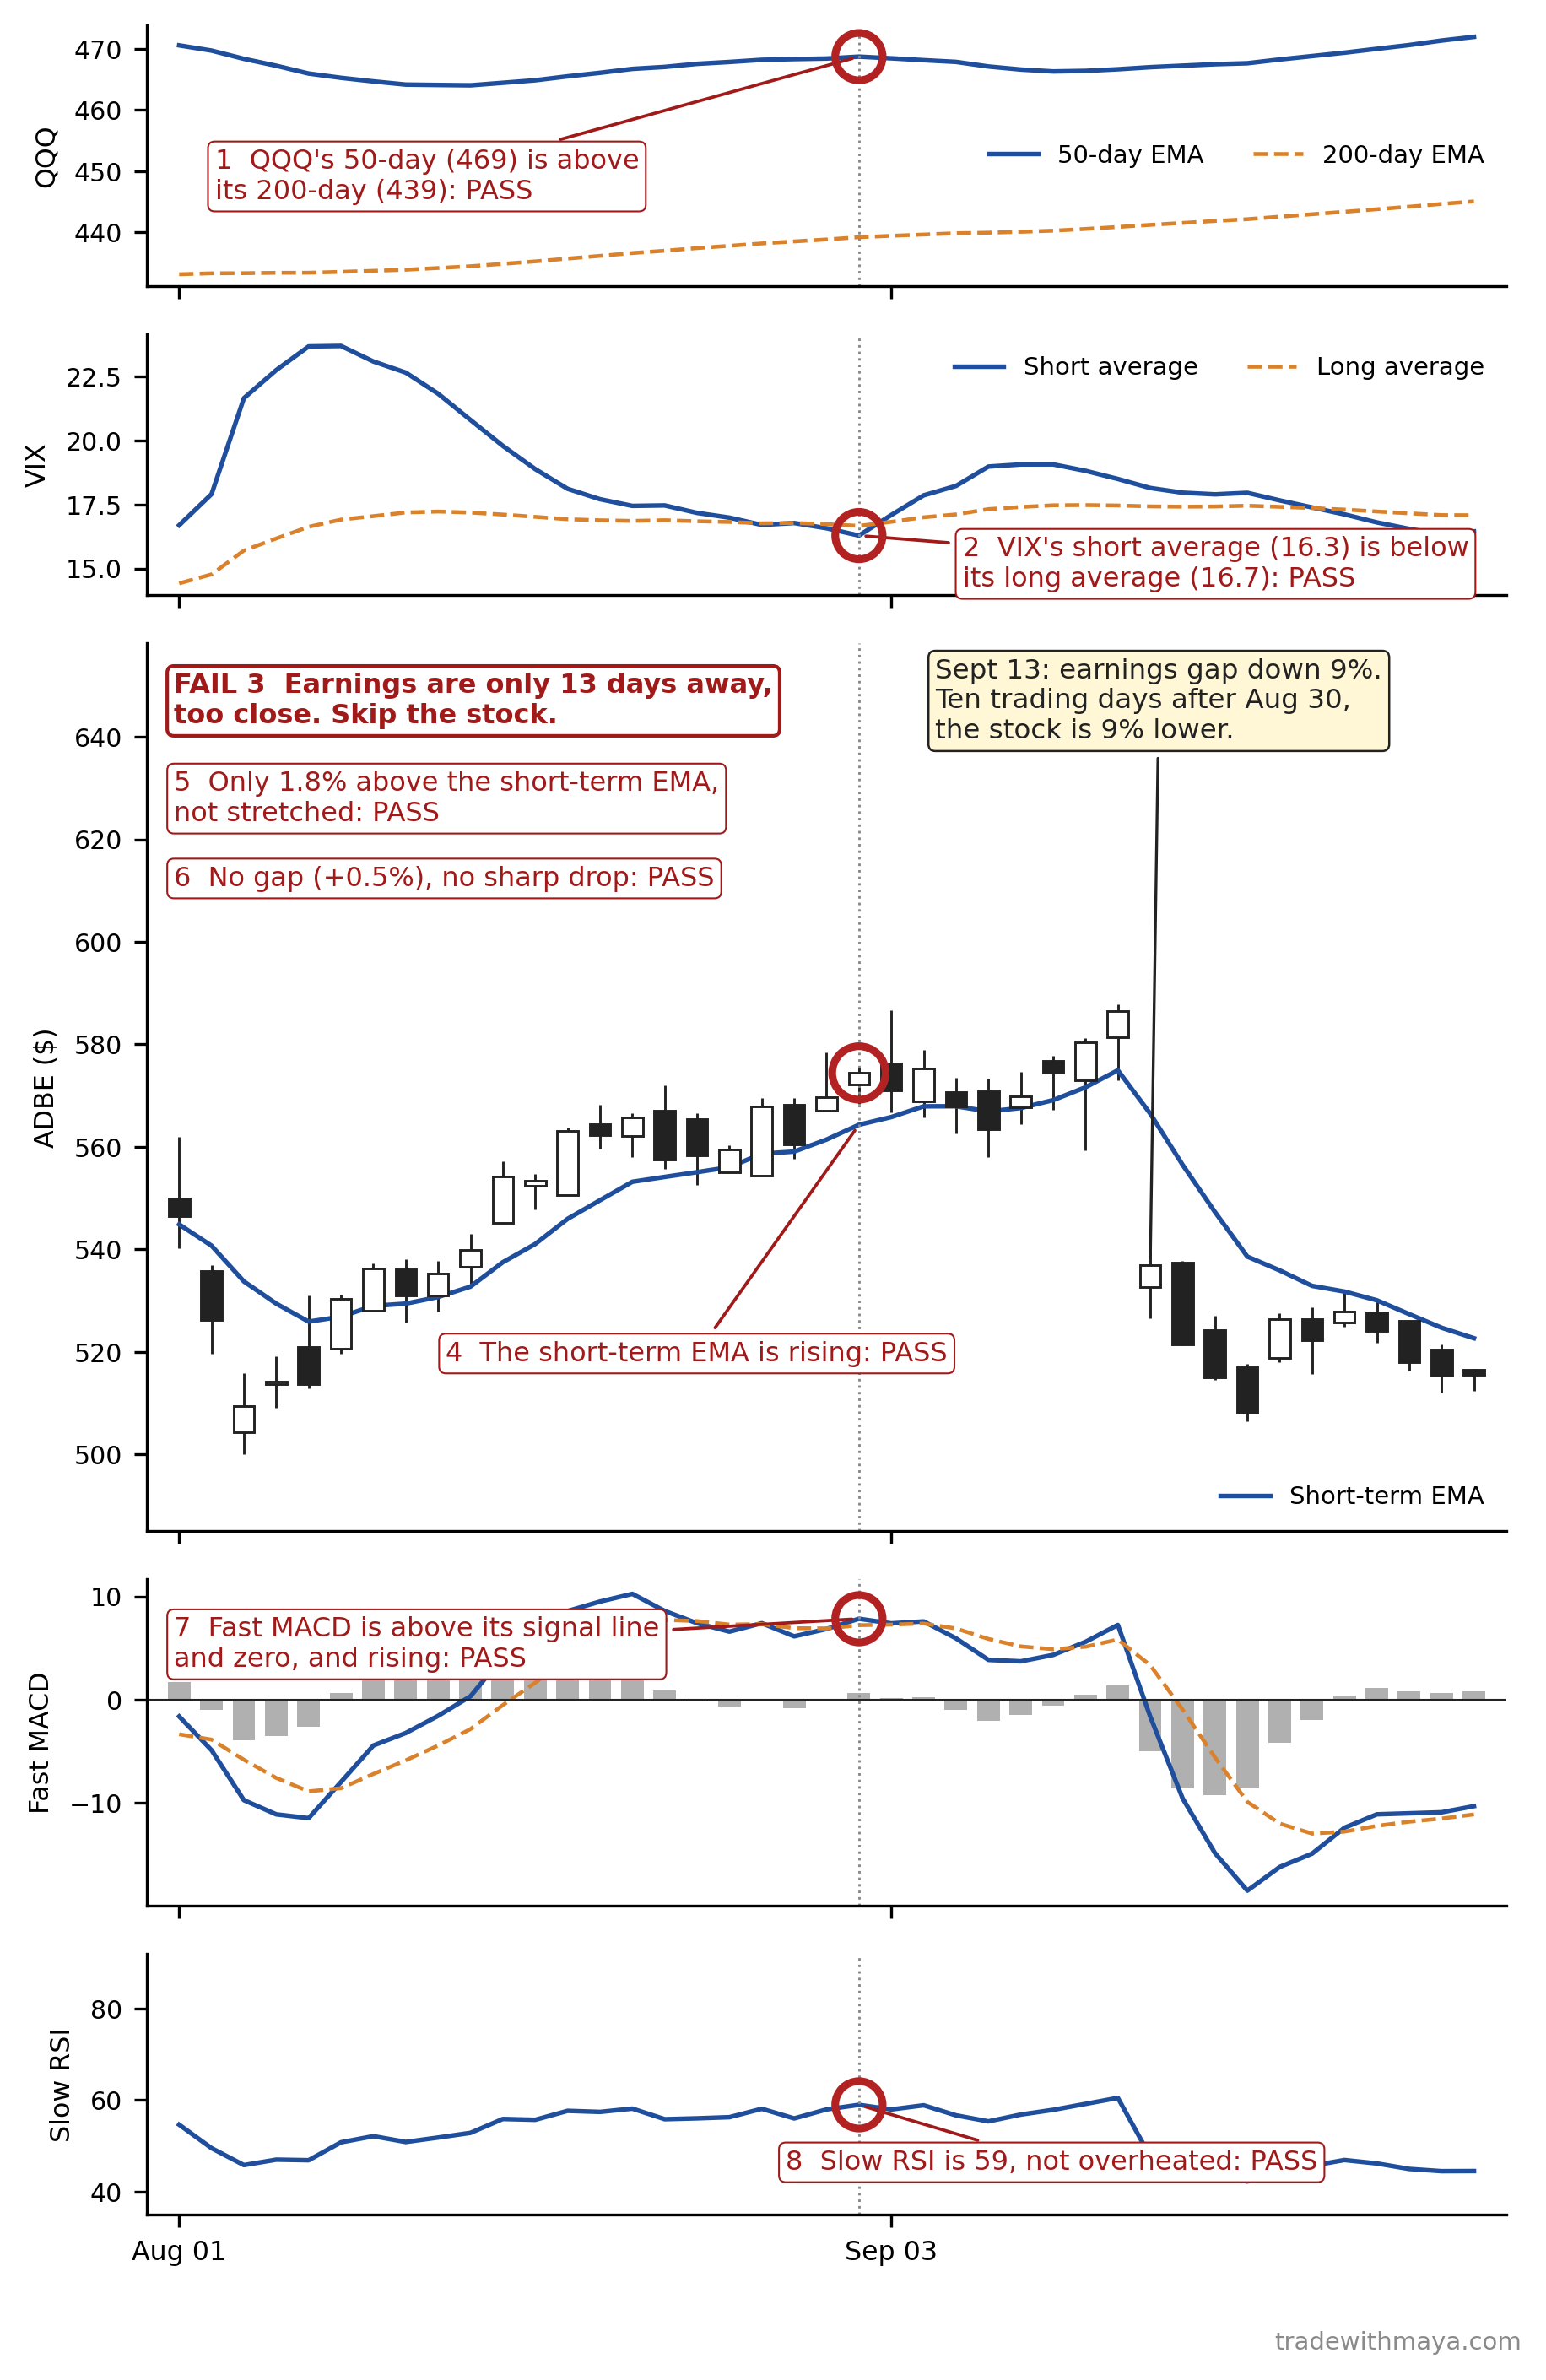
Adobe in August and September 2024, on the same layout.
Adobe in August and September 2024, on the same layout. Download full size
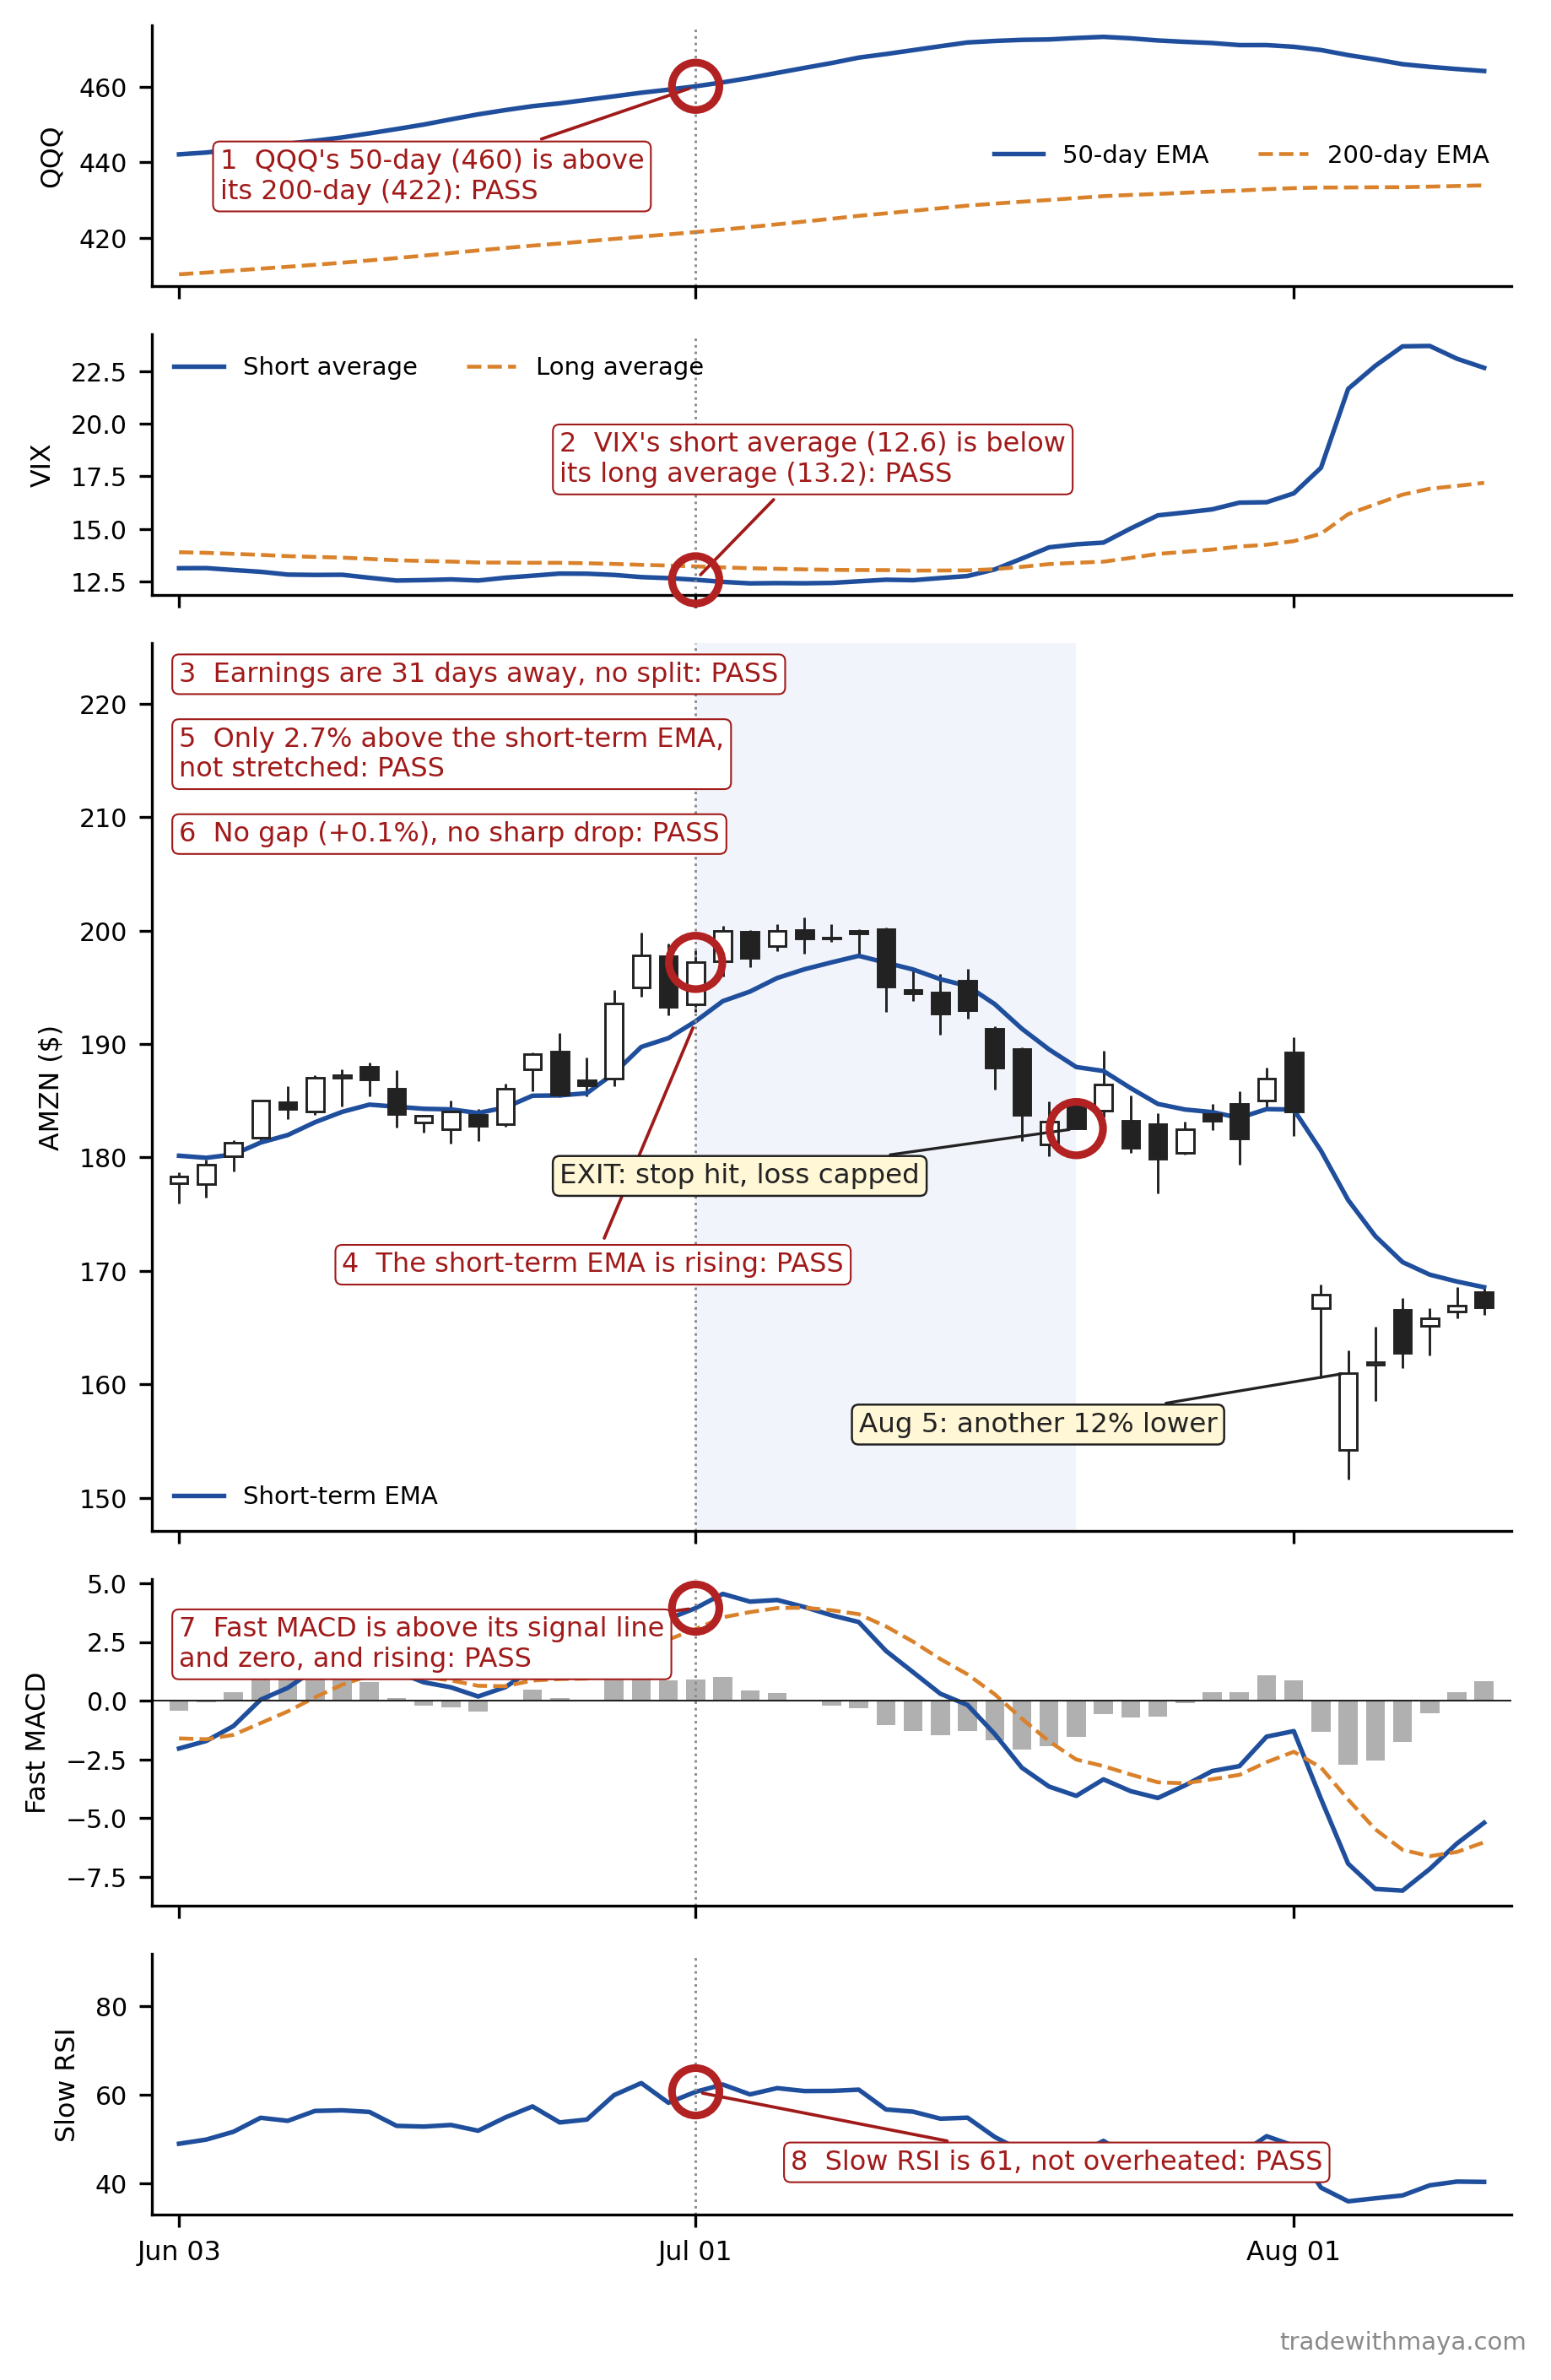
Amazon in June, July, and August 2024, on the same layout.
Amazon in June, July, and August 2024, on the same layout. Download full size

Chapter 11: Exits: Deciding Before You EnterBack to top
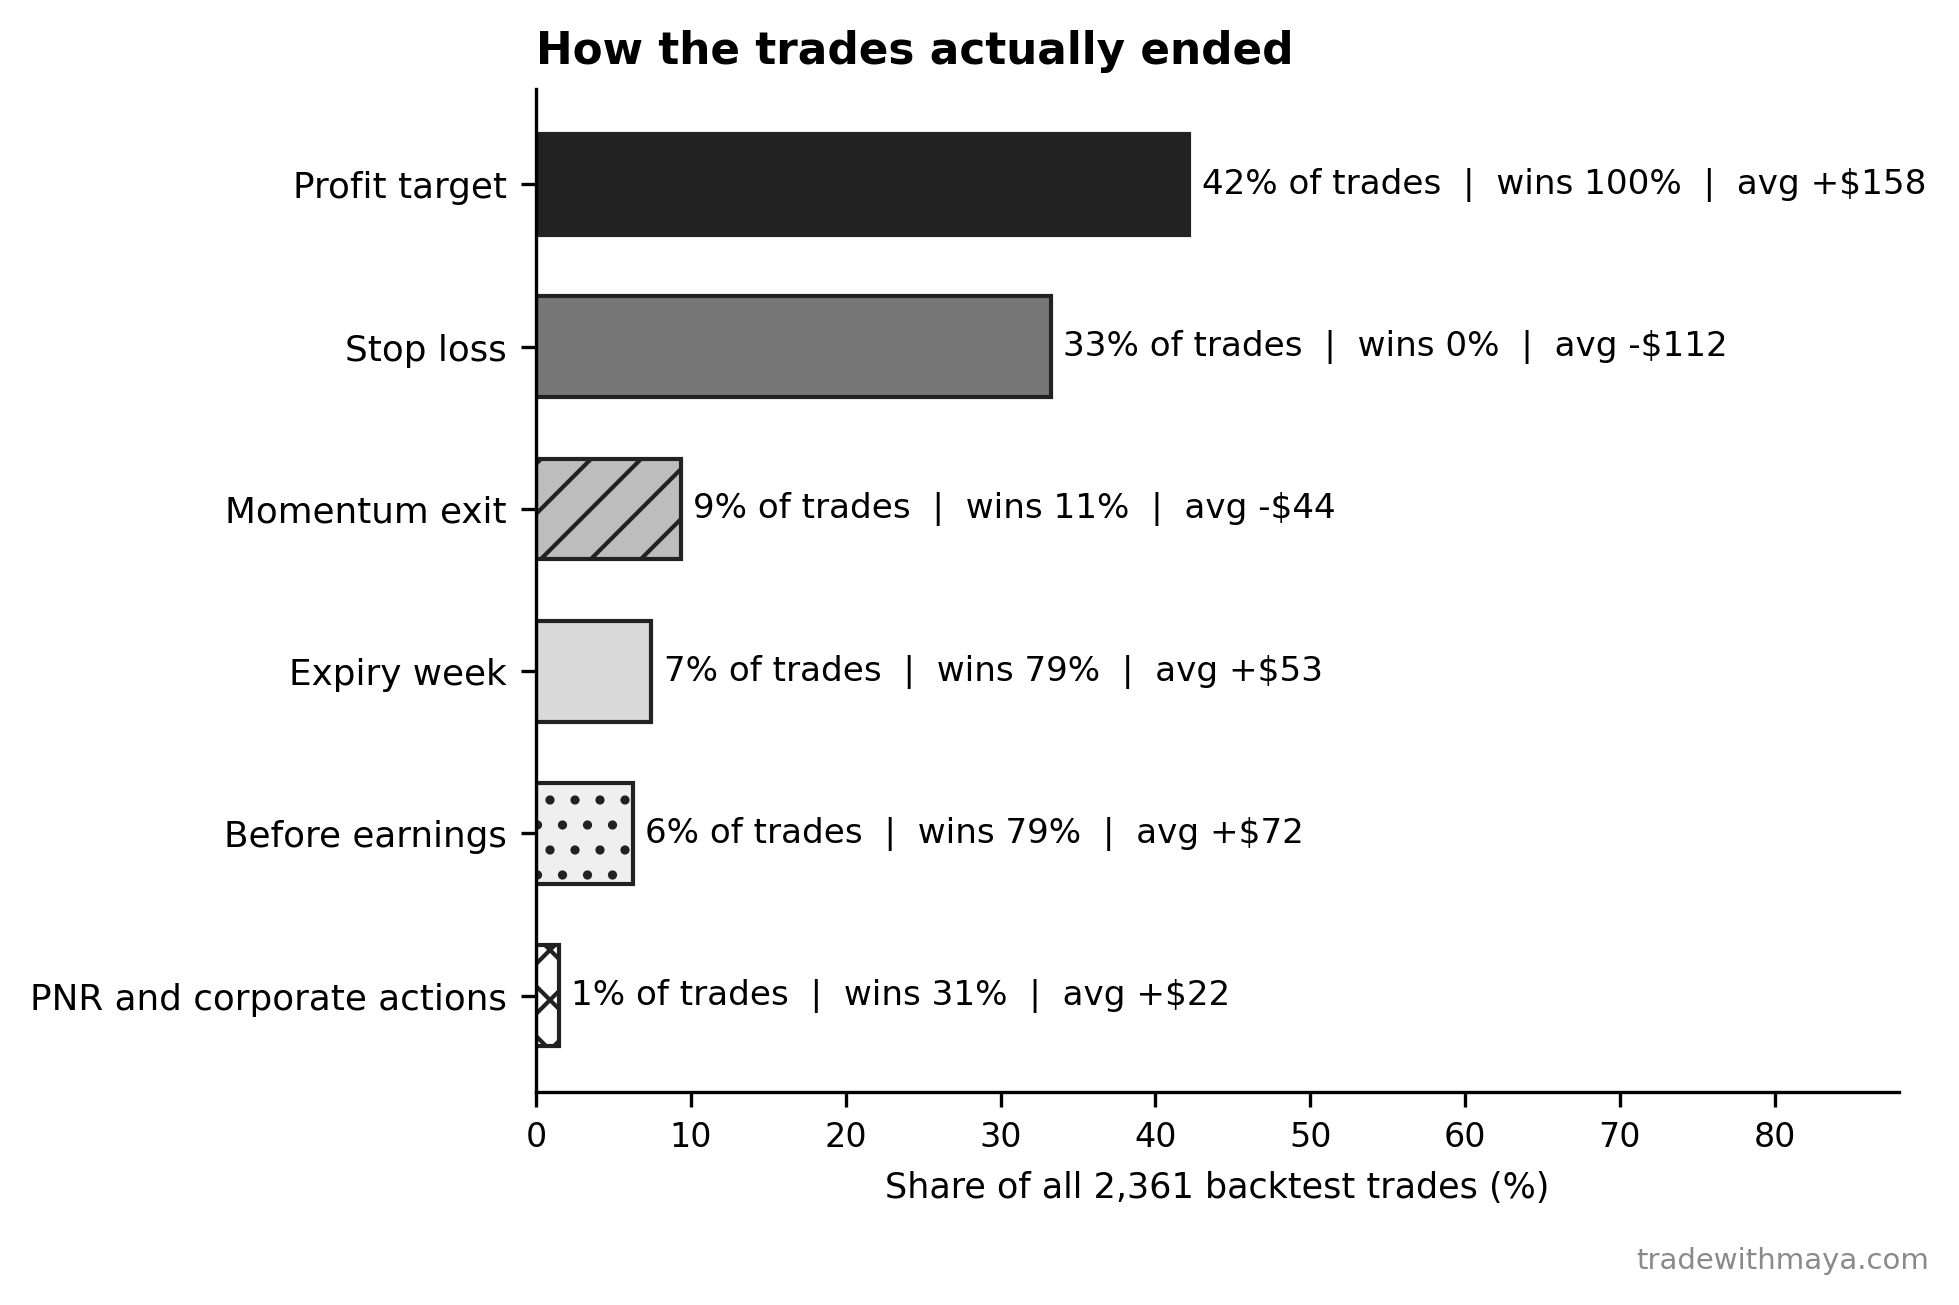
How the 2,361 backtest trades ended, sorted by the exit that closed them, with the win rate and average result for each.
How the 2,361 backtest trades ended, sorted by the exit that closed them, with the win rate and average result for each. Download full size
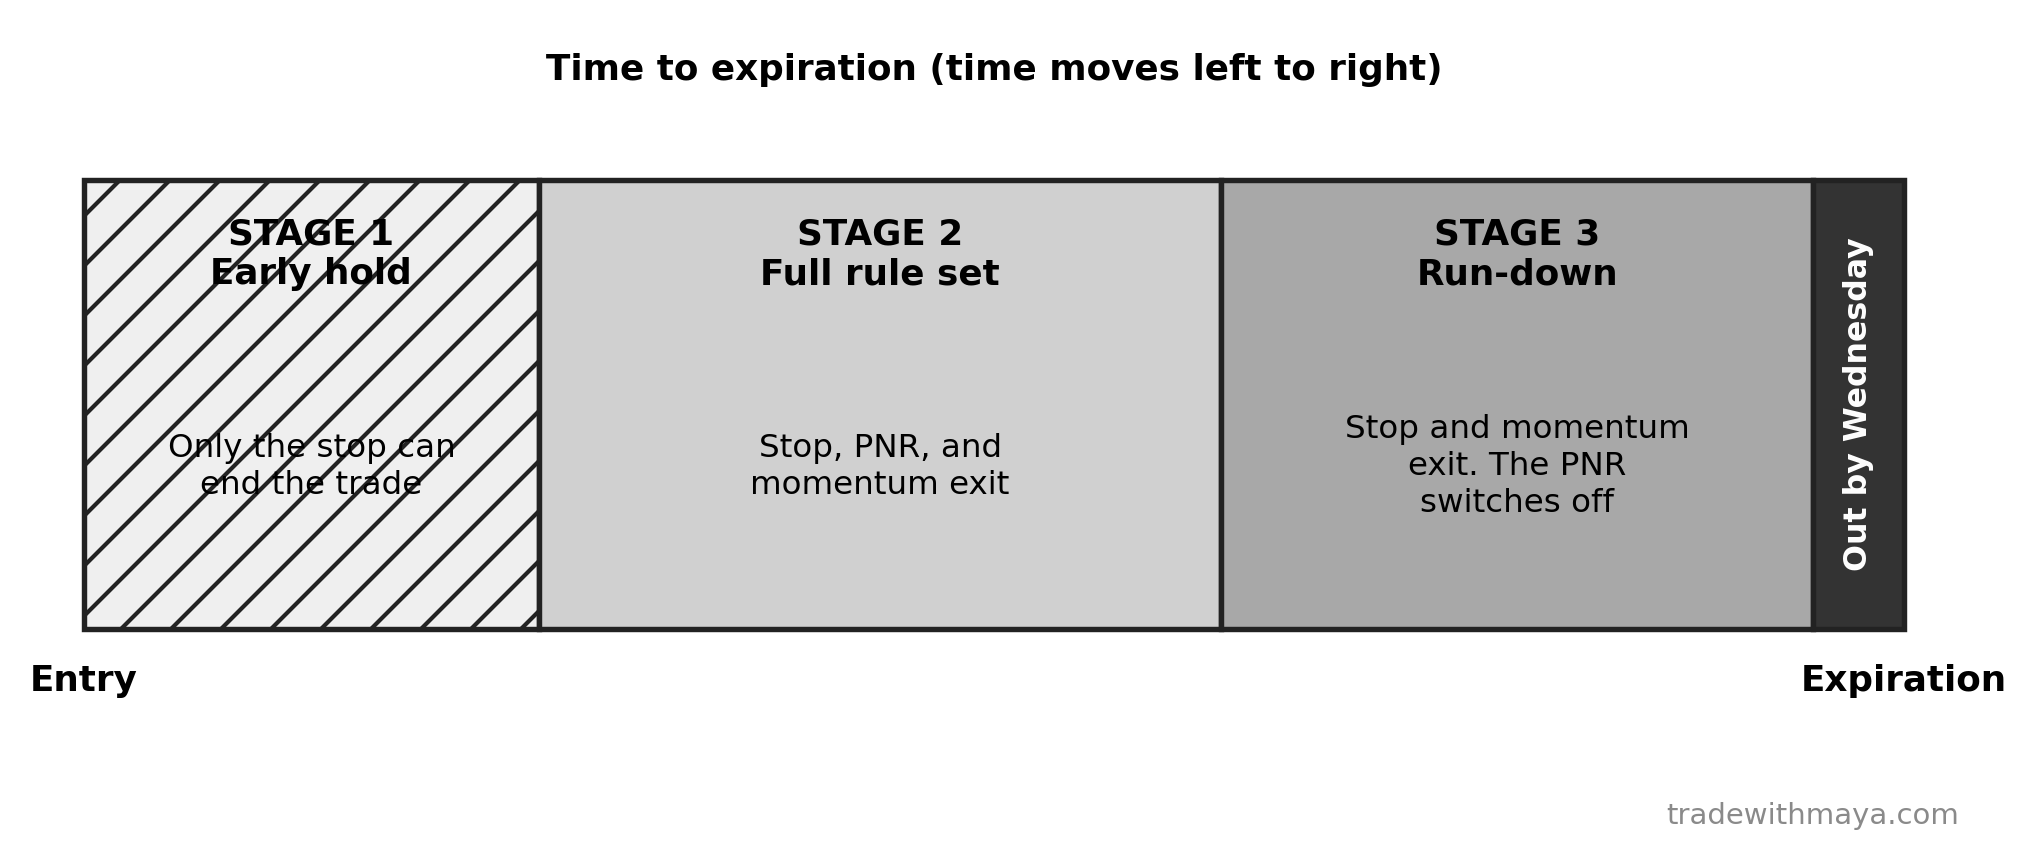
The exit rules by stage.
The exit rules by stage. Download full size
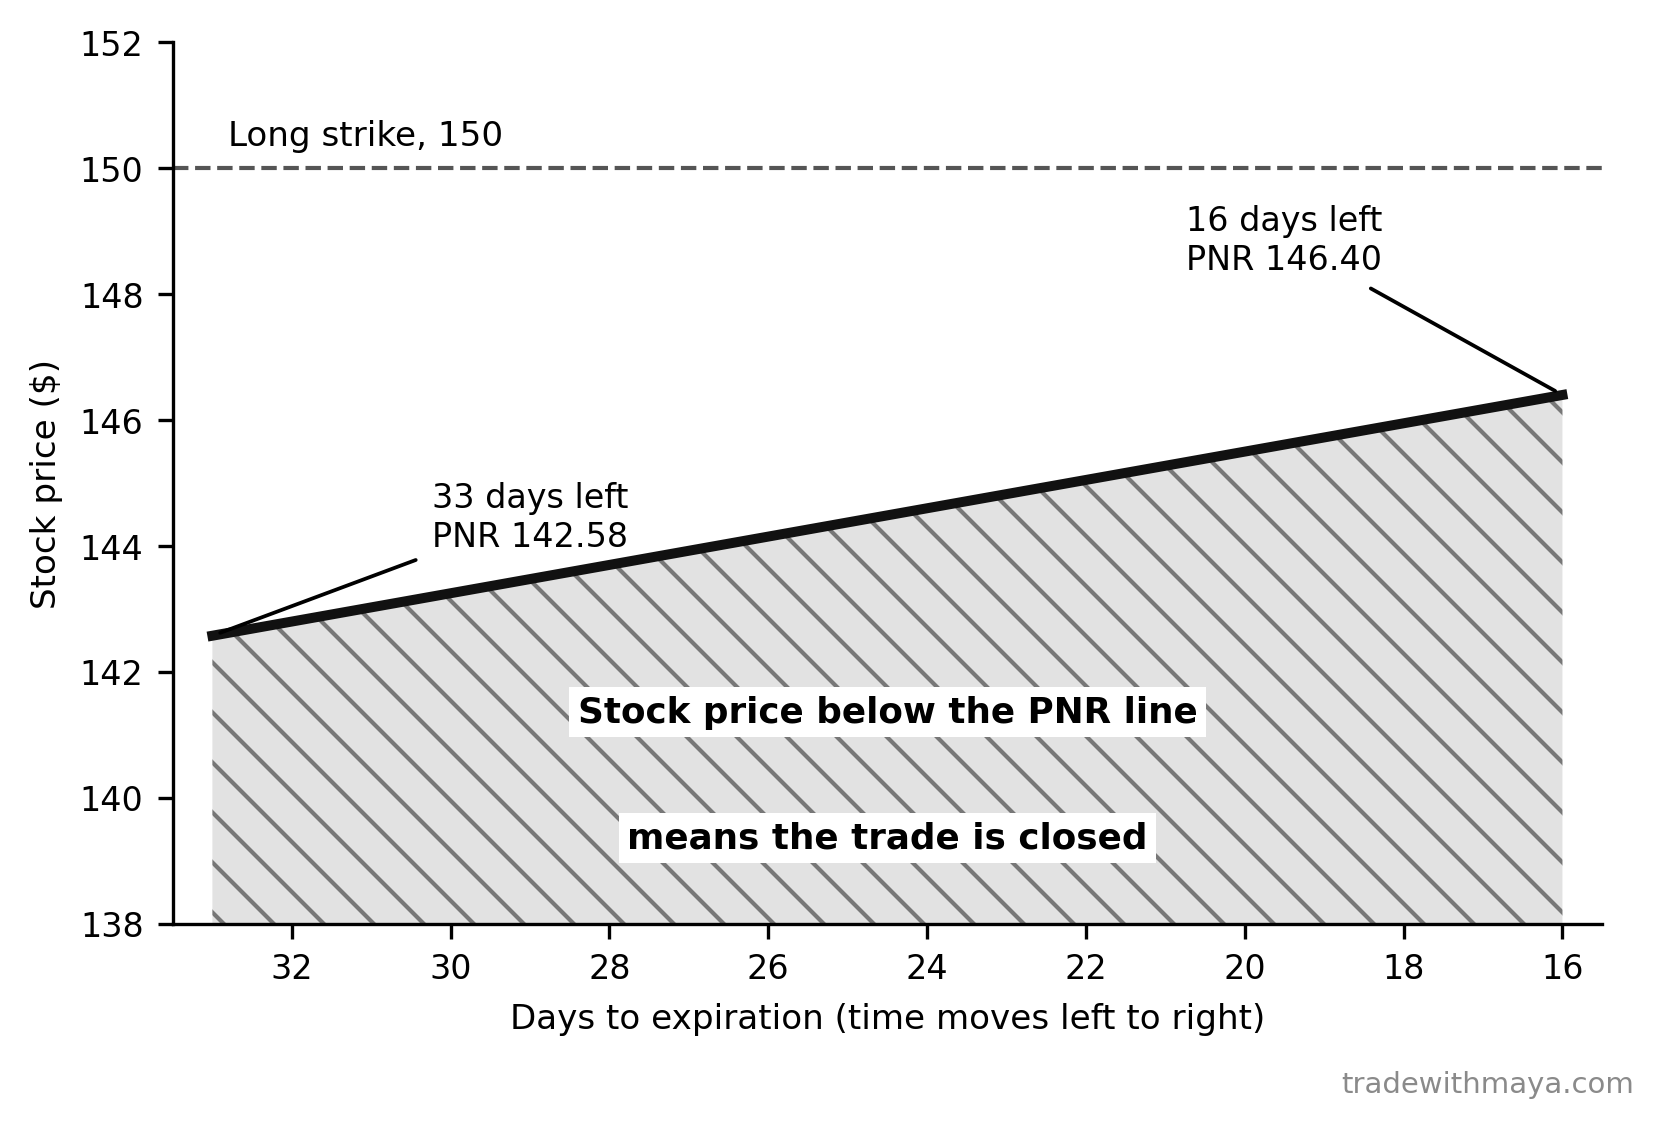
The PNR for a 150 long strike and a $3 ATR.
The PNR for a 150 long strike and a $3 ATR. Download full size
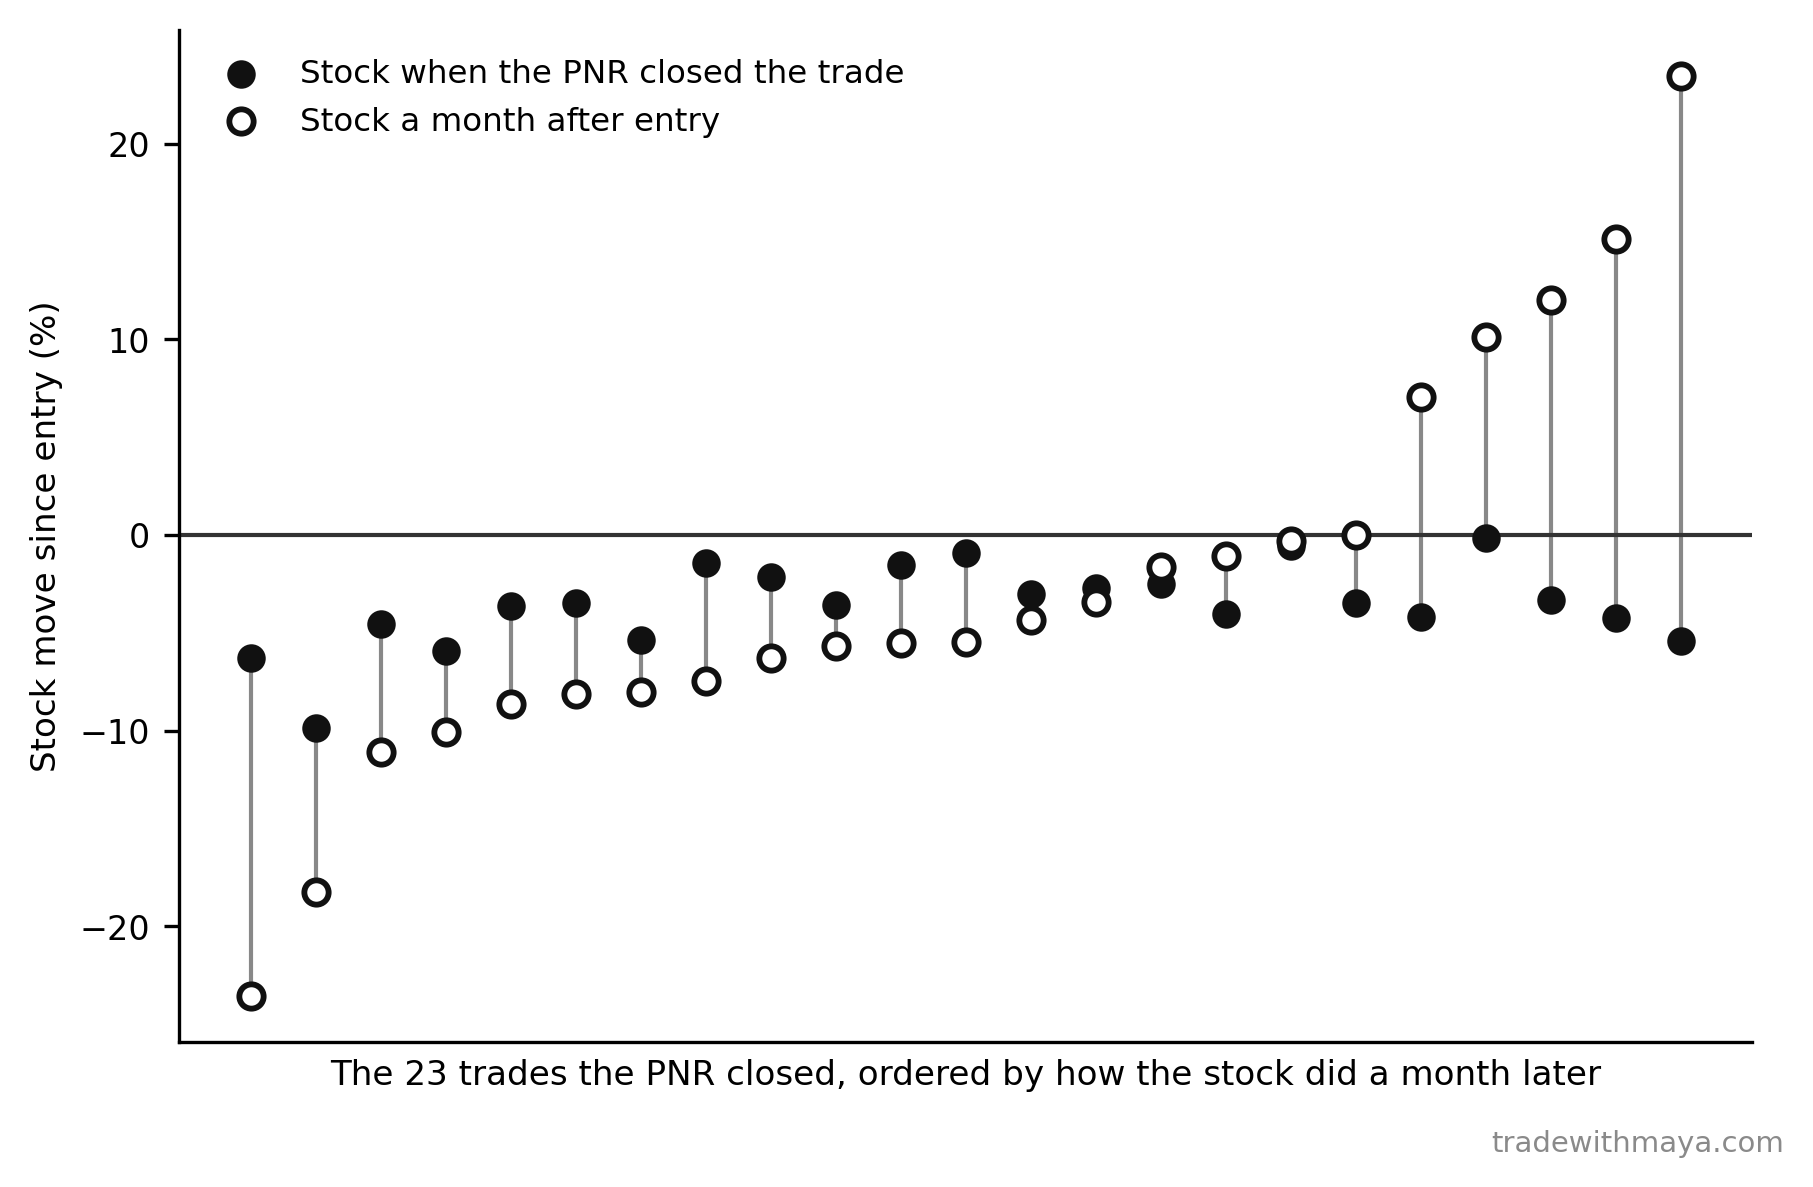
The backtest trades the PNR closed.
The backtest trades the PNR closed. Download full size
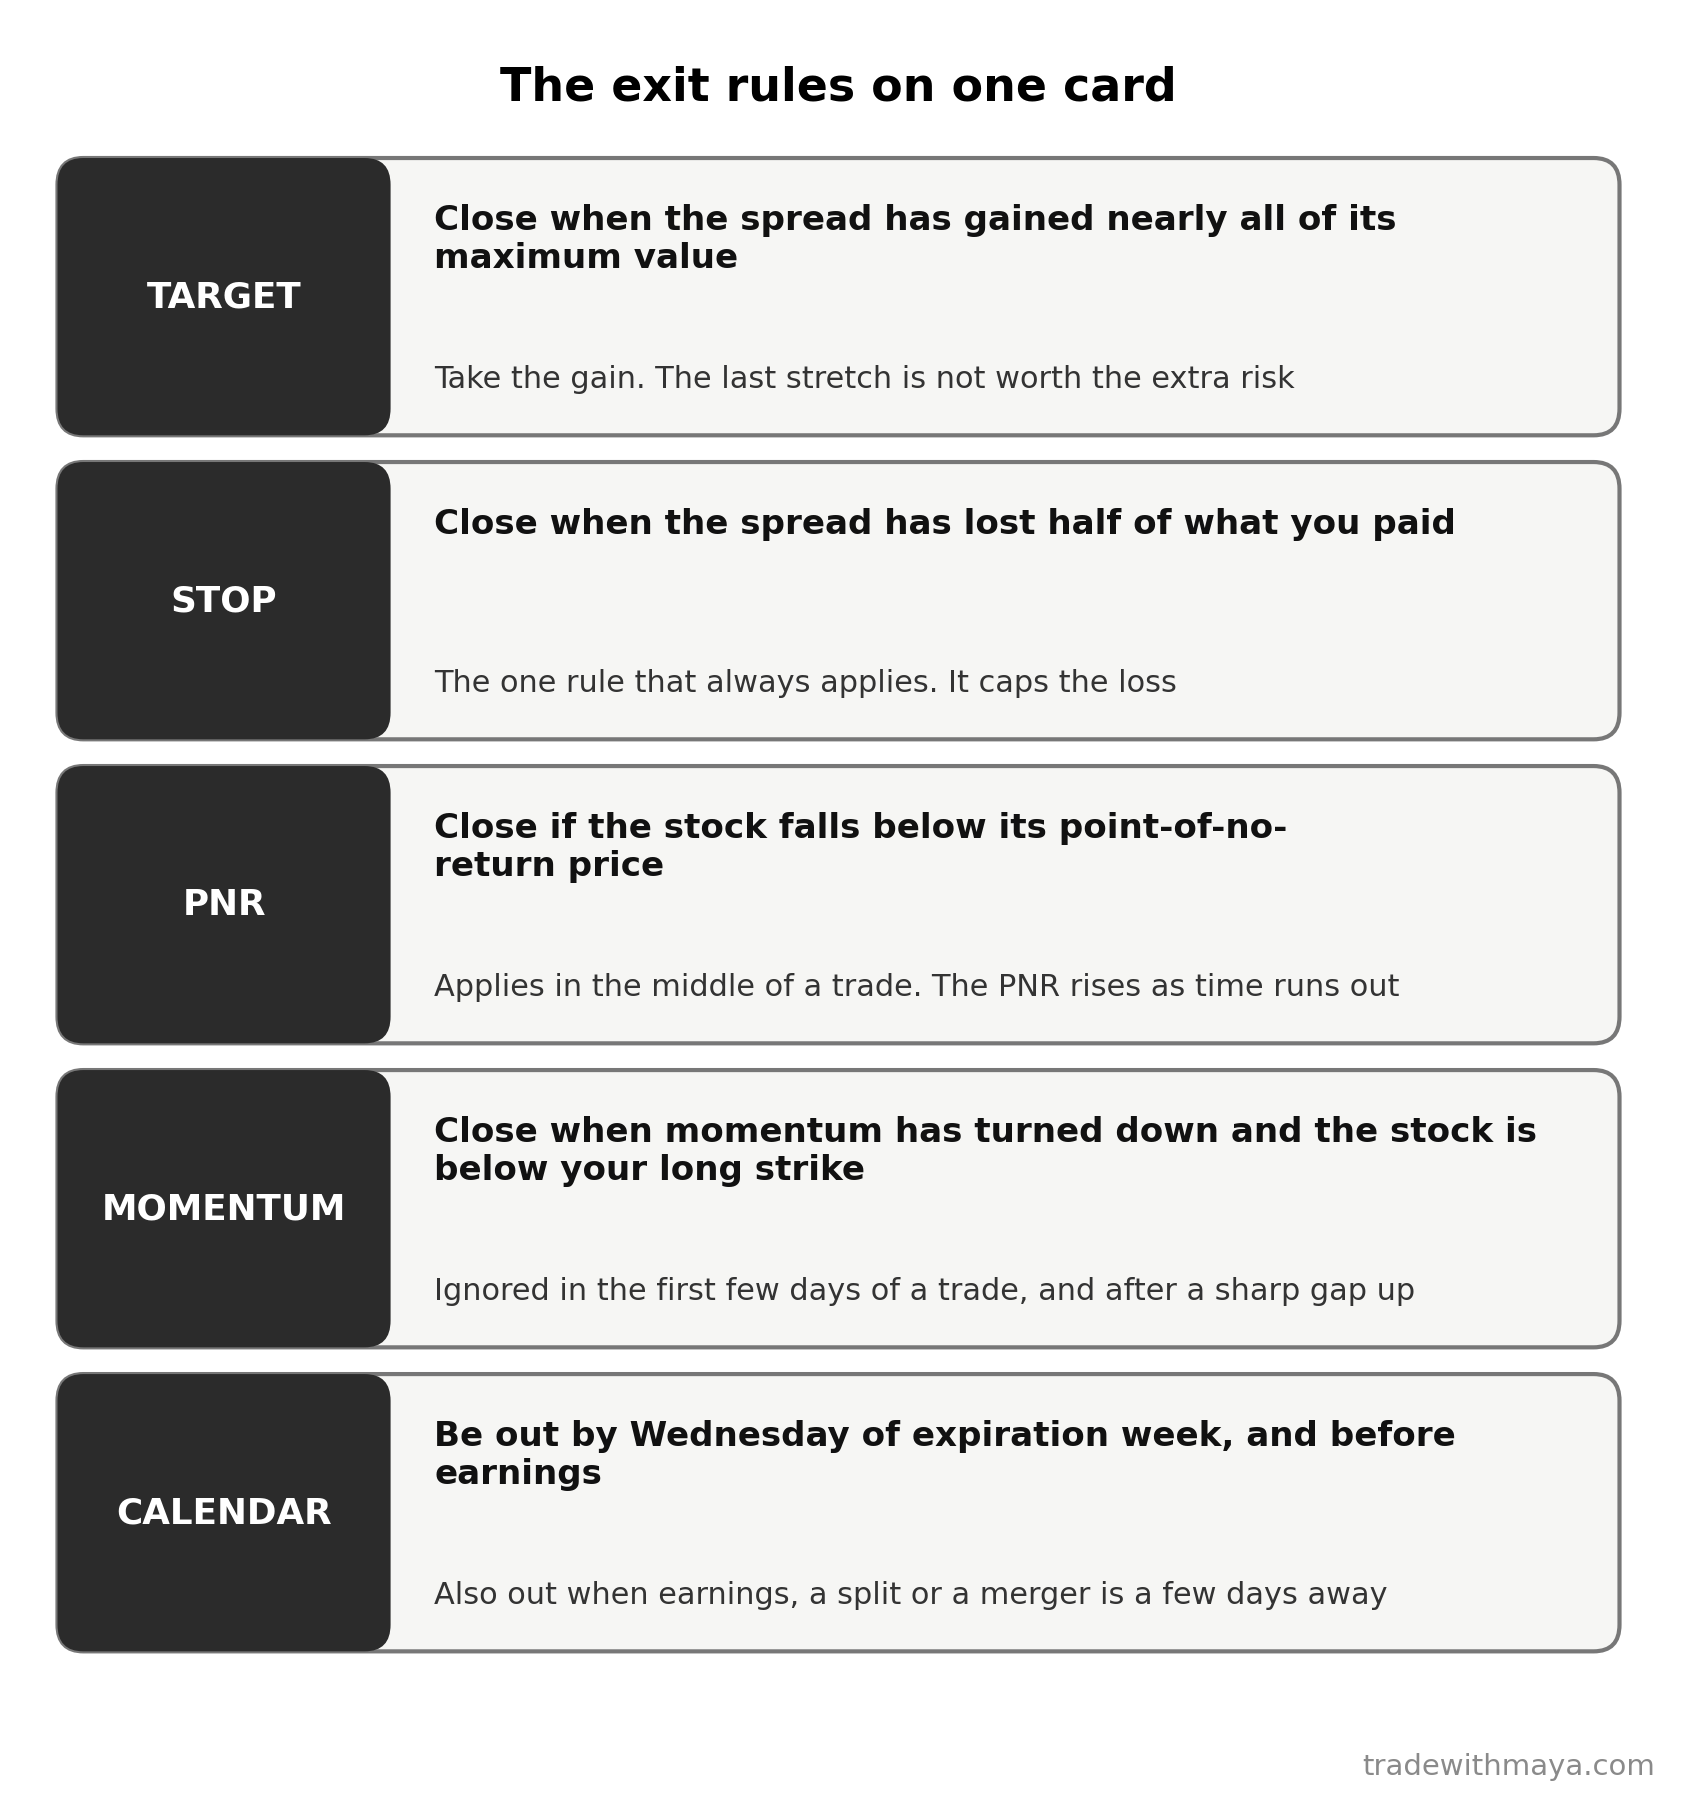
The exit settings on one card.
The exit settings on one card. Download full size

Chapter 12: Sizing Without Blowing UpBack to top
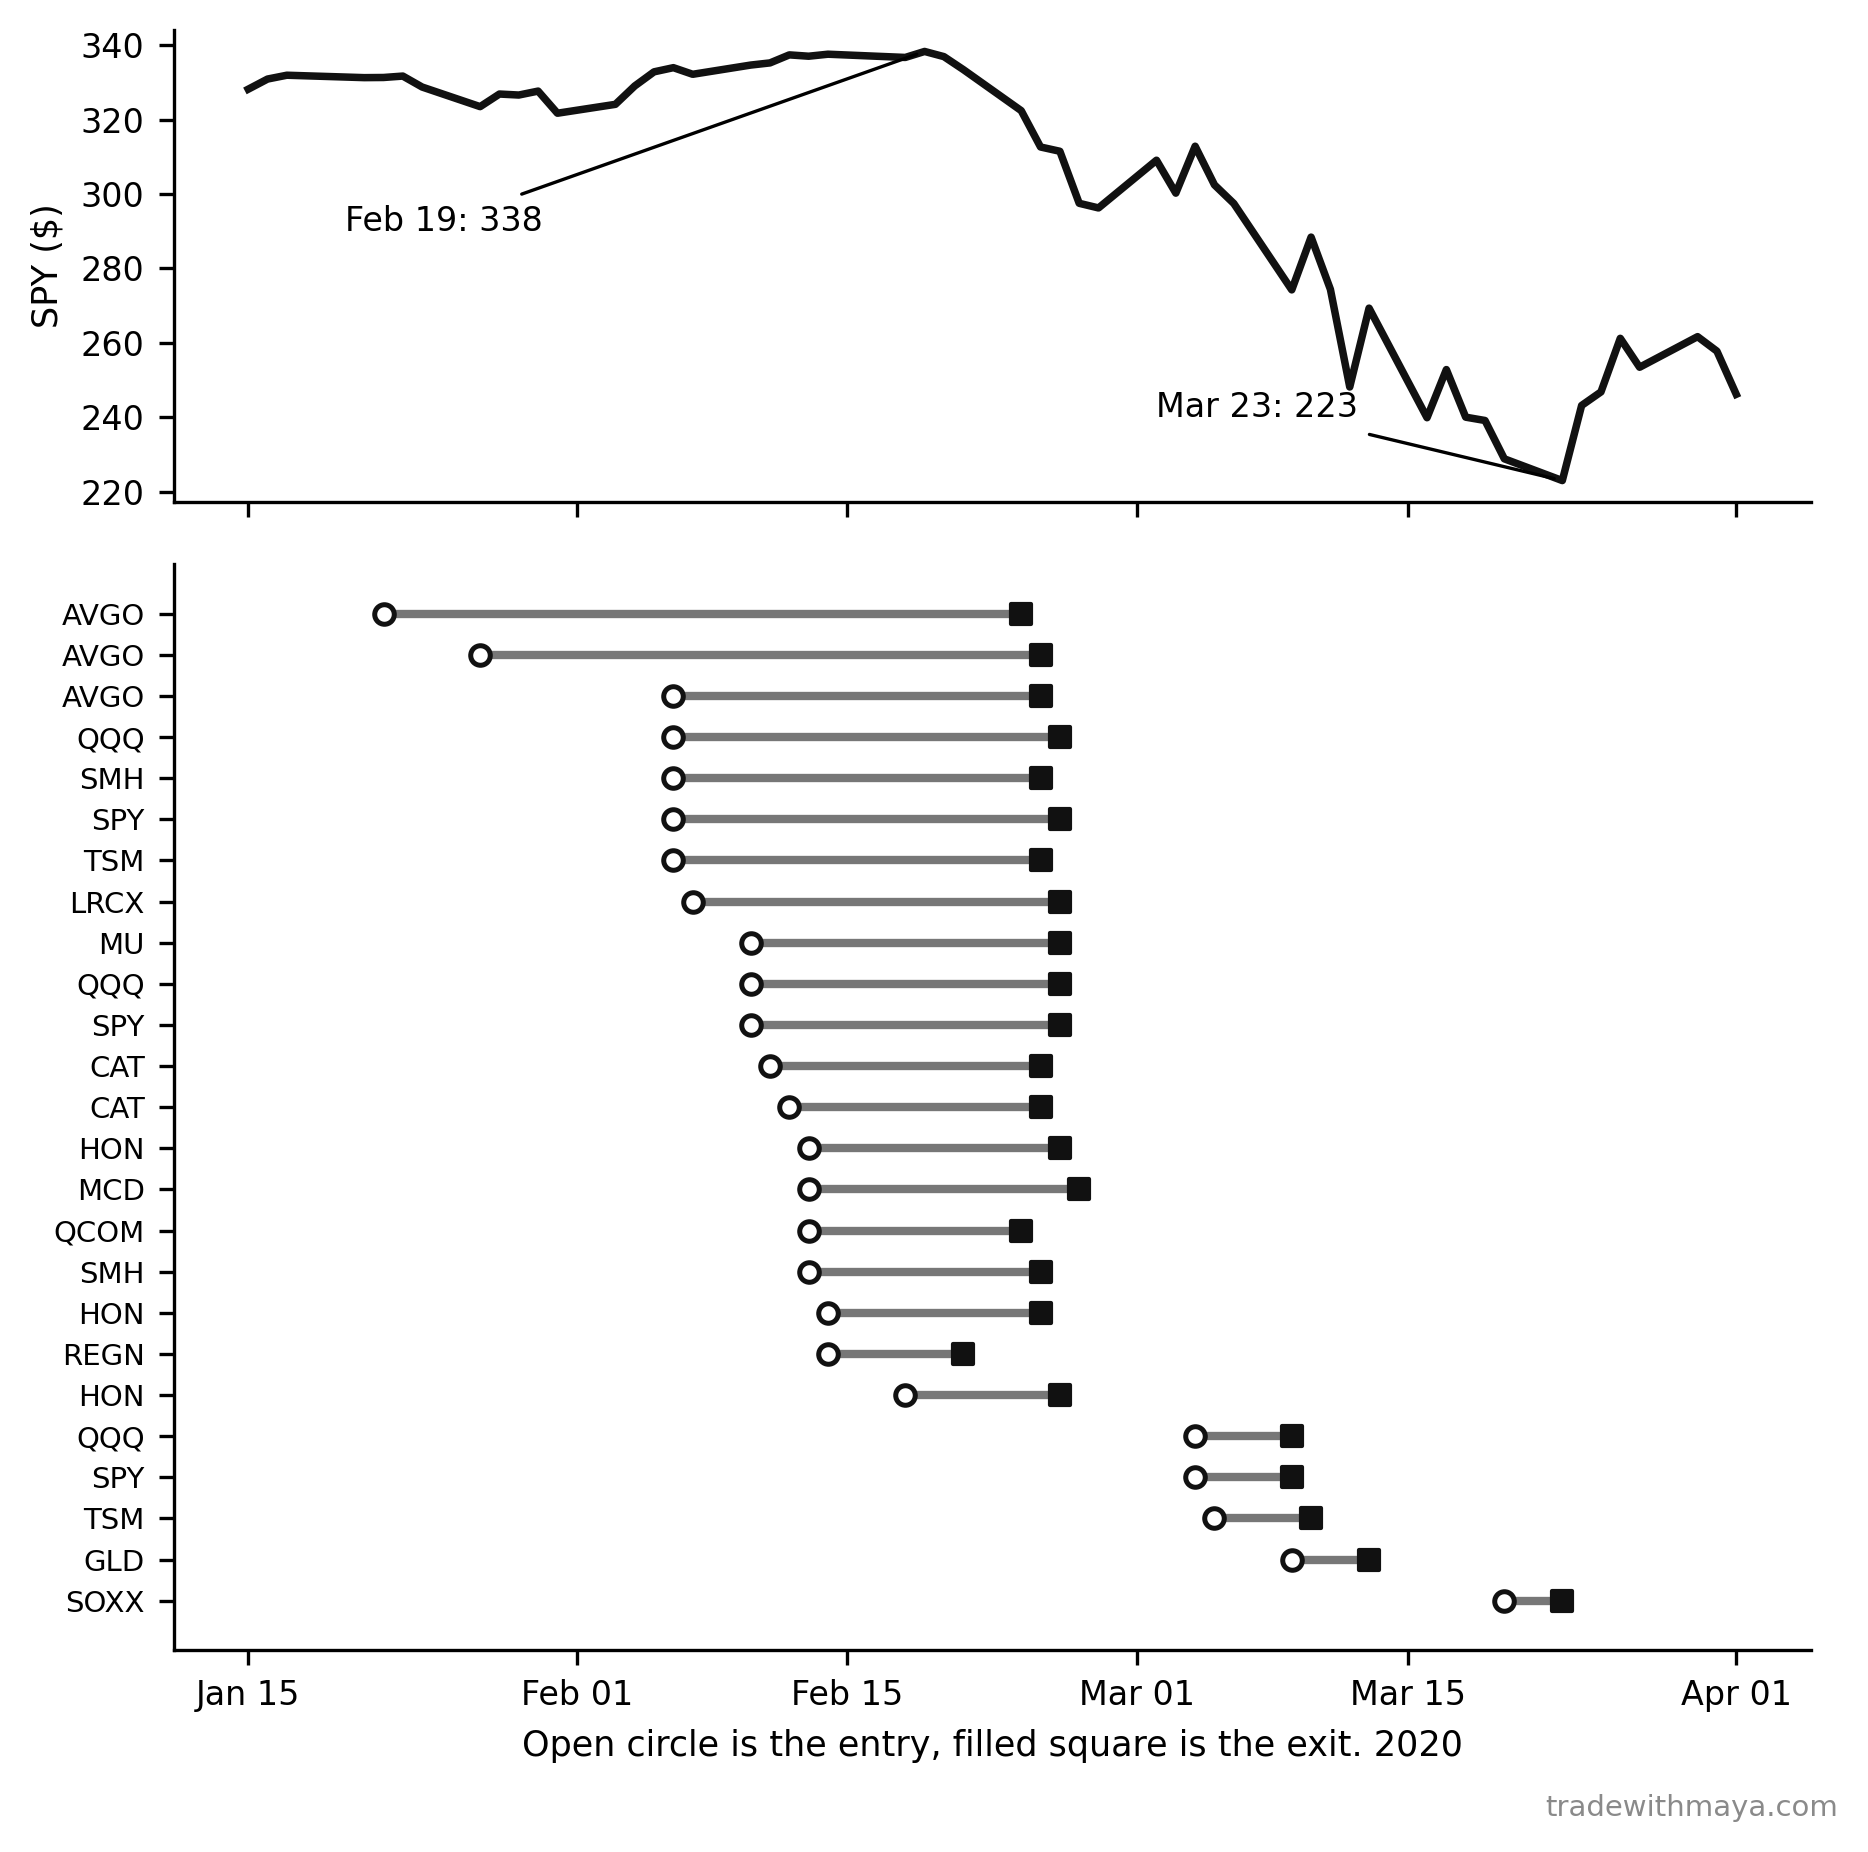
The longest losing streak in the backtest.
The longest losing streak in the backtest. Download full size
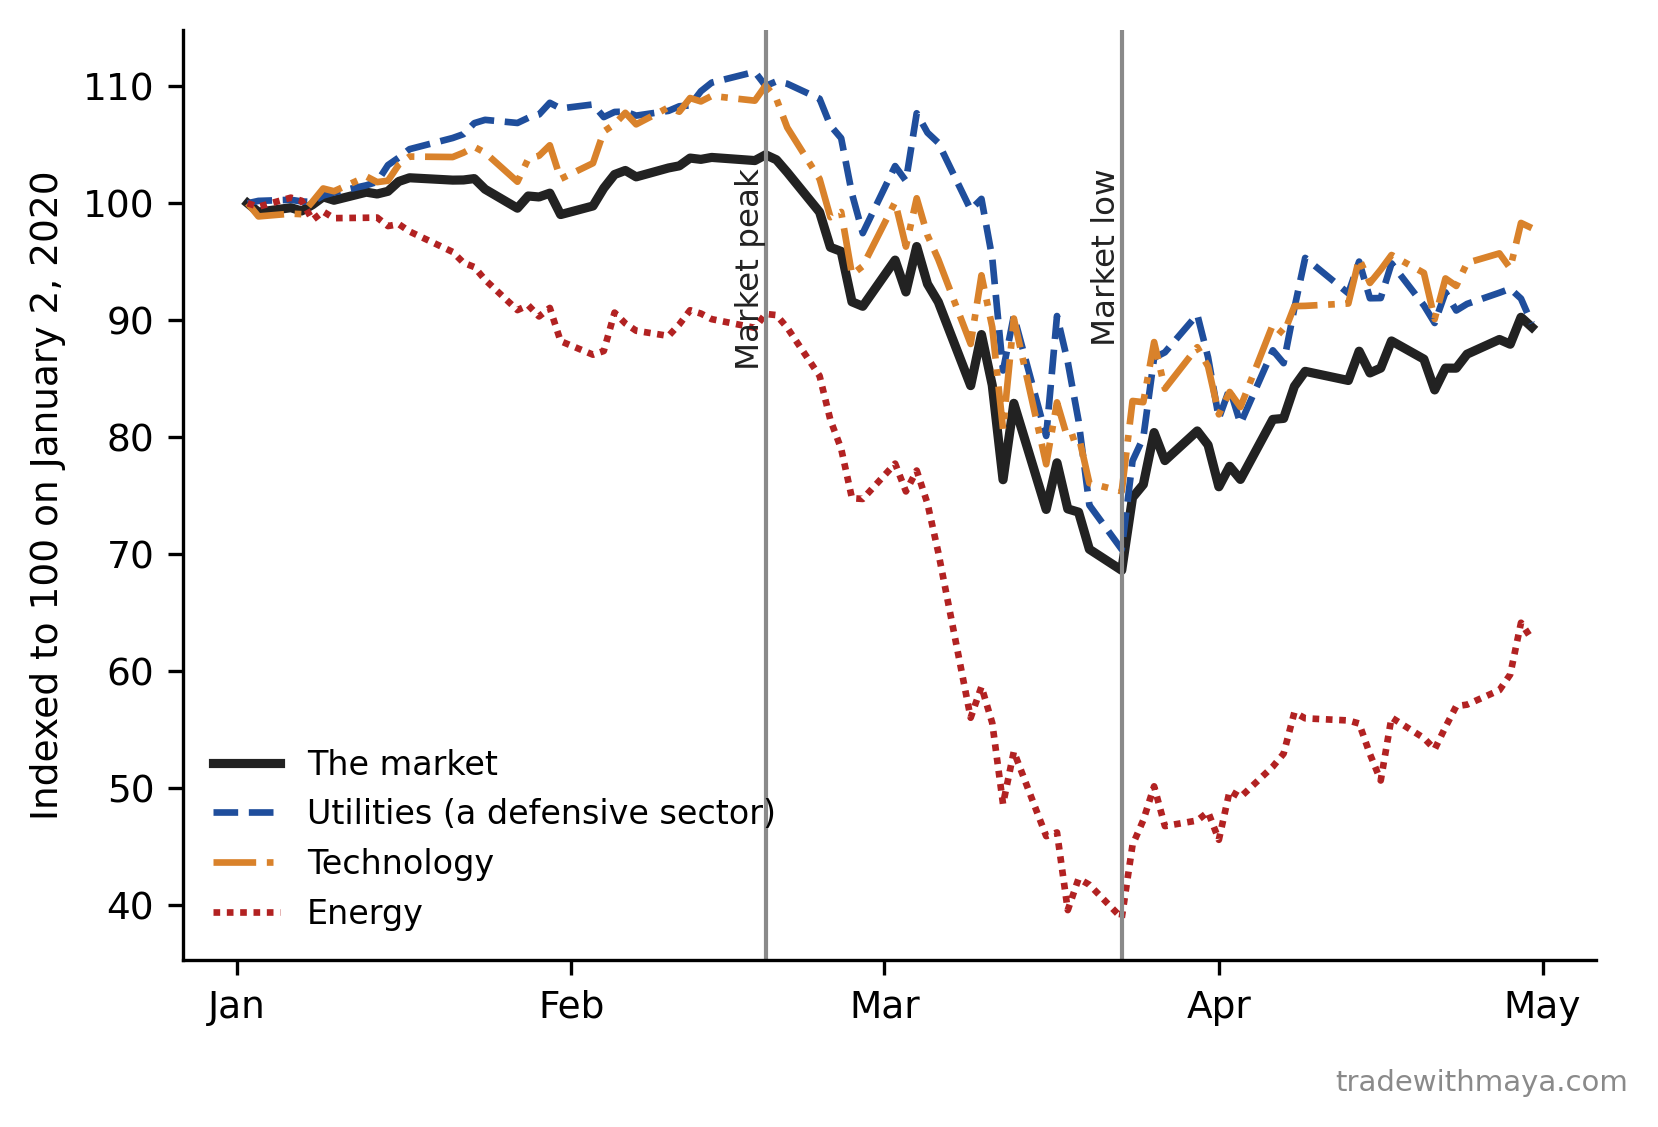
SPY against four sector ETFs, rebased to 100 at the start of 2020.
SPY against four sector ETFs, rebased to 100 at the start of 2020. Download full size
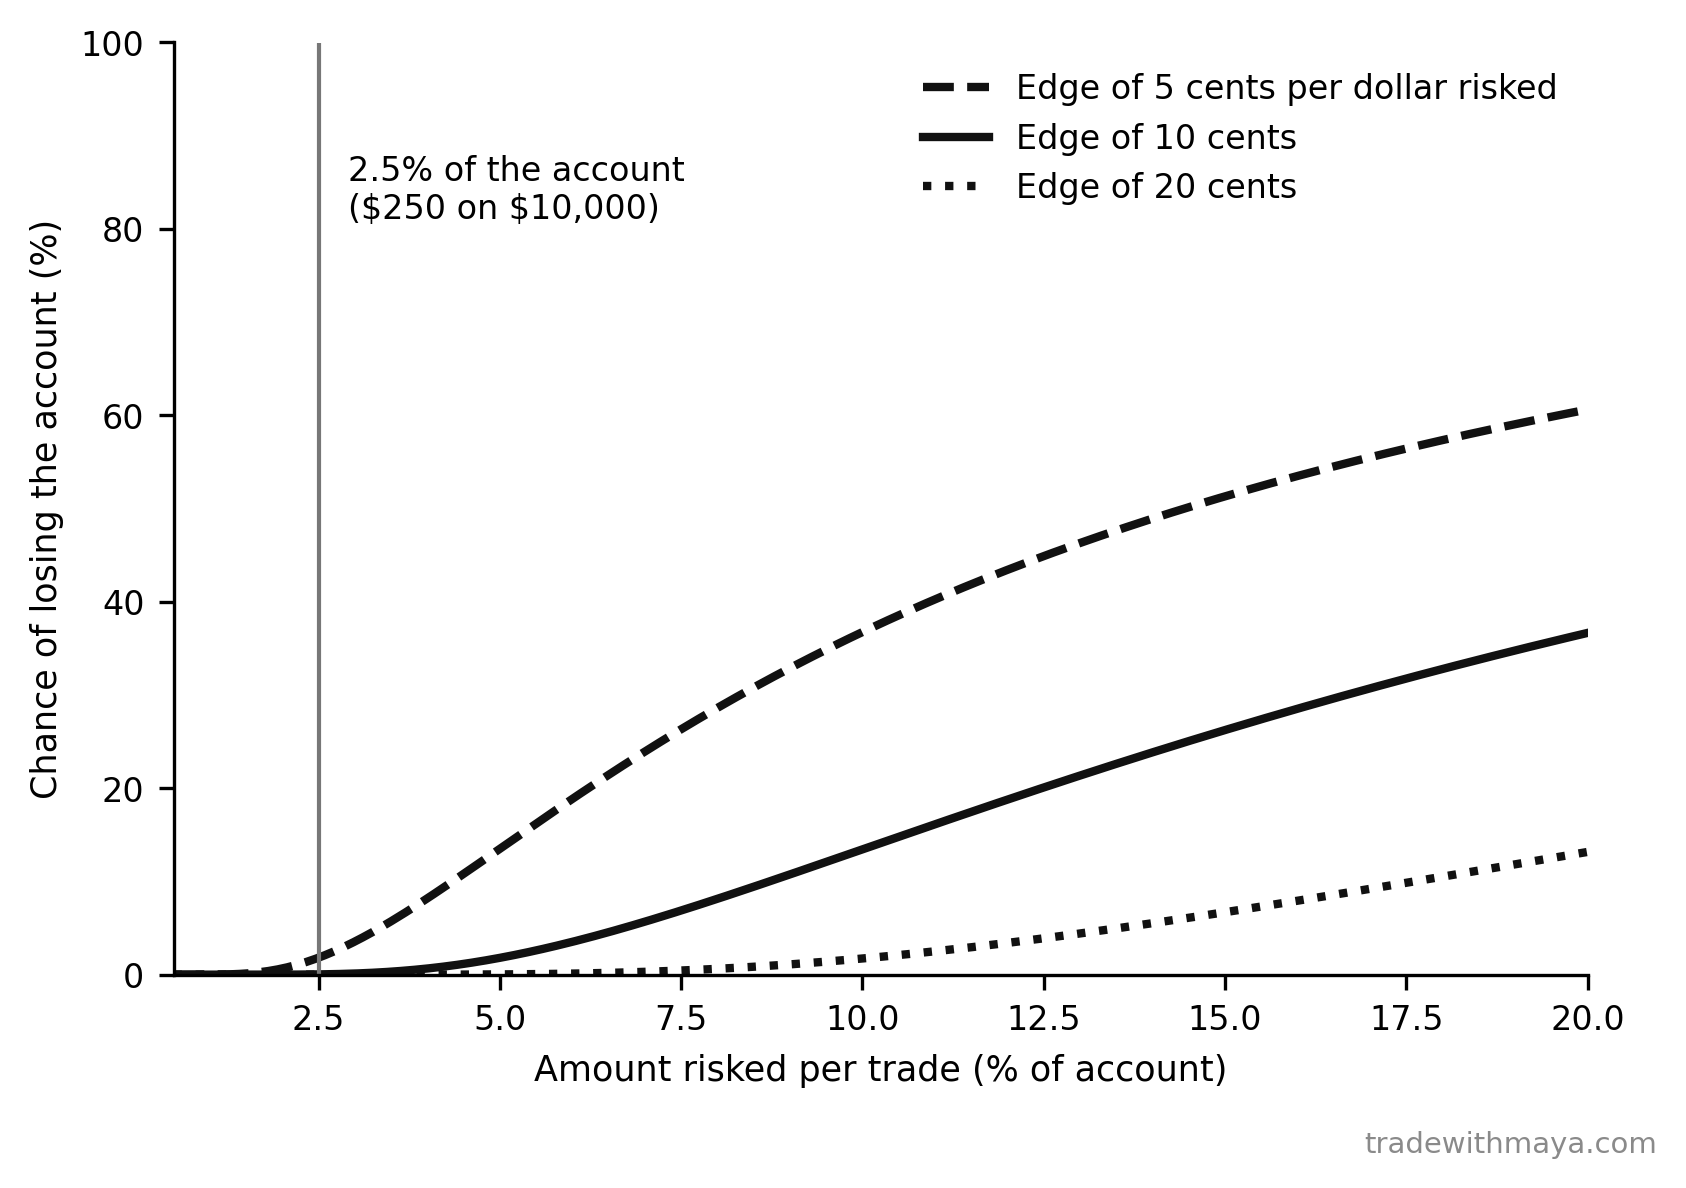
The chance of losing the account for three levels of edge, by the share of the account risked on each trade.
The chance of losing the account for three levels of edge, by the share of the account risked on each trade. Download full size
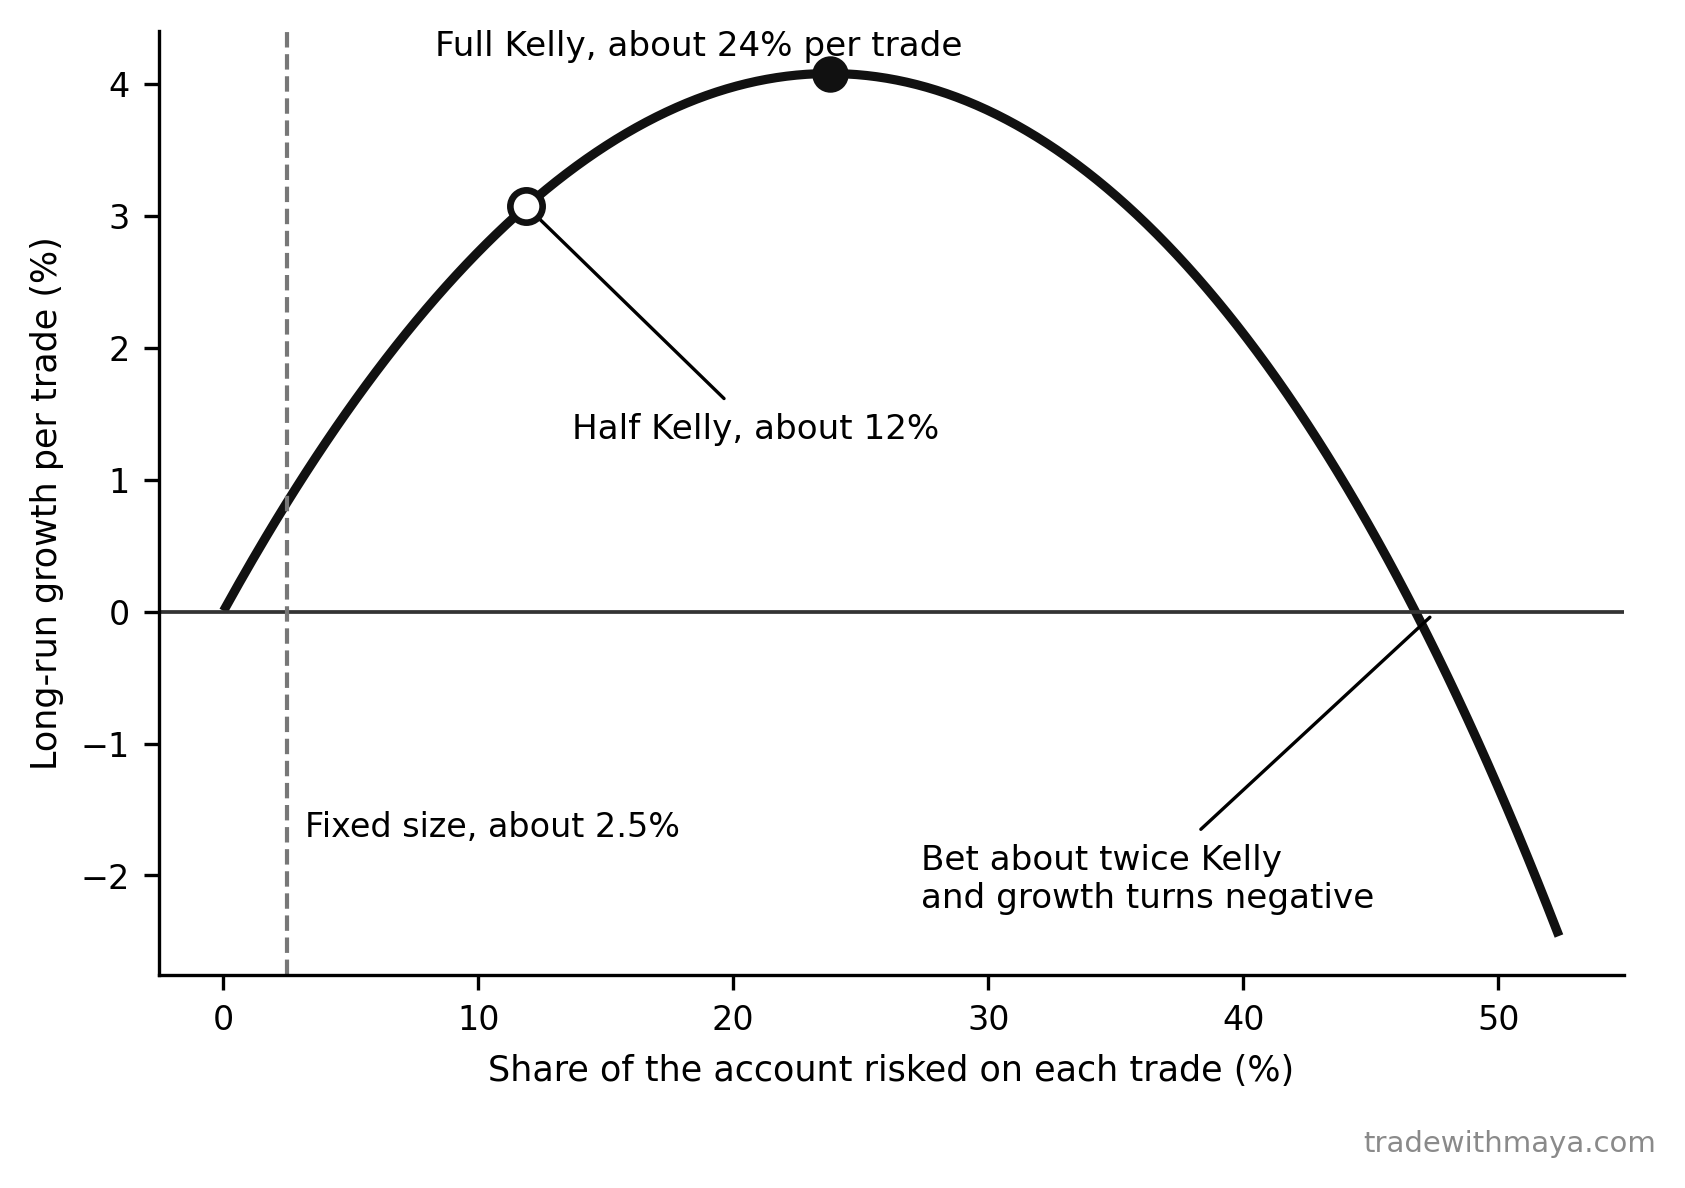
Long-run growth per trade against the share of the account risked, using the win rate and win-to-loss ratio from our backtest.
Long-run growth per trade against the share of the account risked, using the win rate and win-to-loss ratio from our backtest. Download full size

Chapter 13: Backtesting Without a PhDBack to top
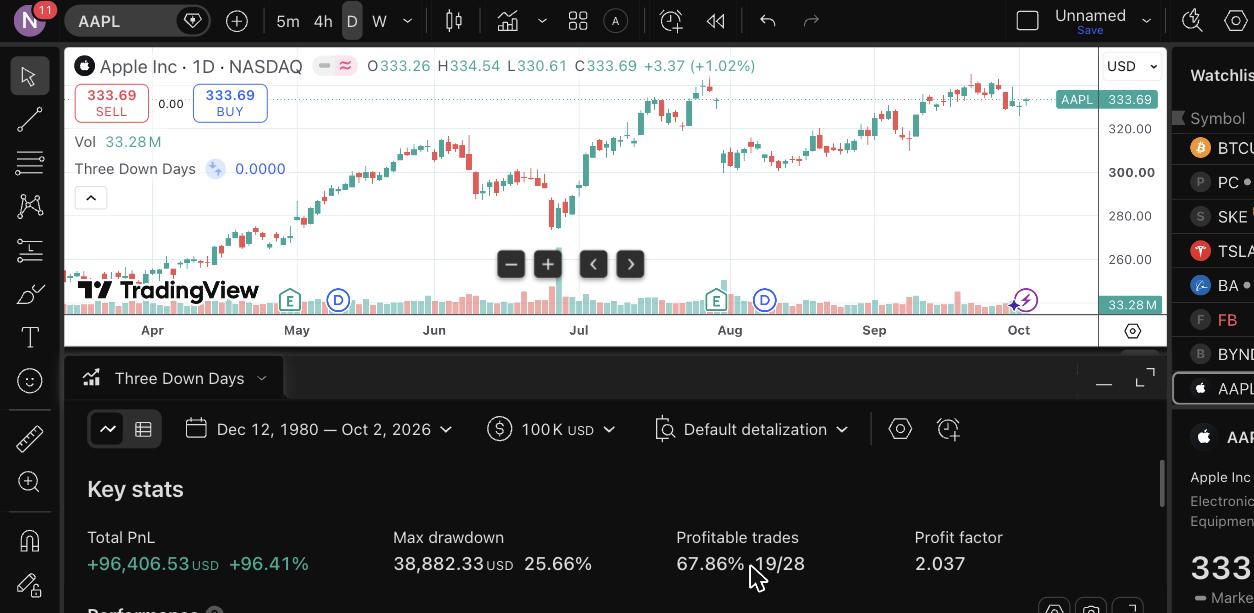
TradingView's Strategy Tester running the Three Down Days rule on real AAPL data.
TradingView's Strategy Tester running the Three Down Days rule on real AAPL data. Download full size
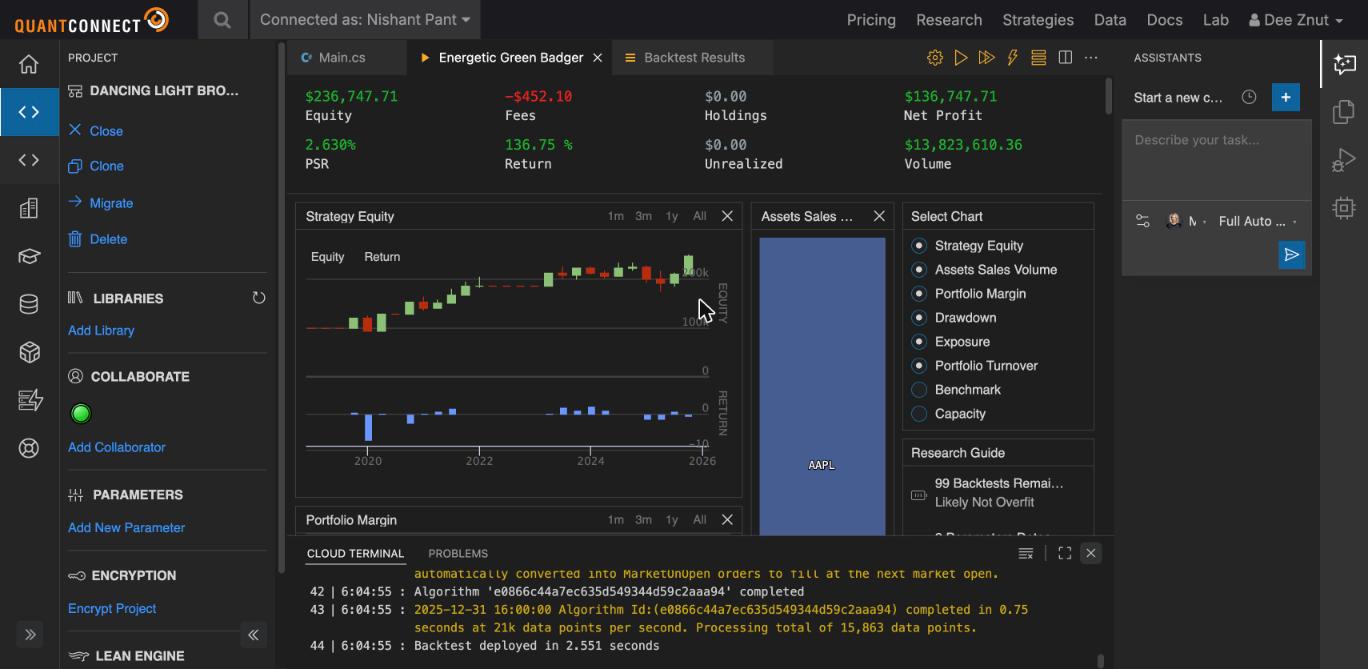
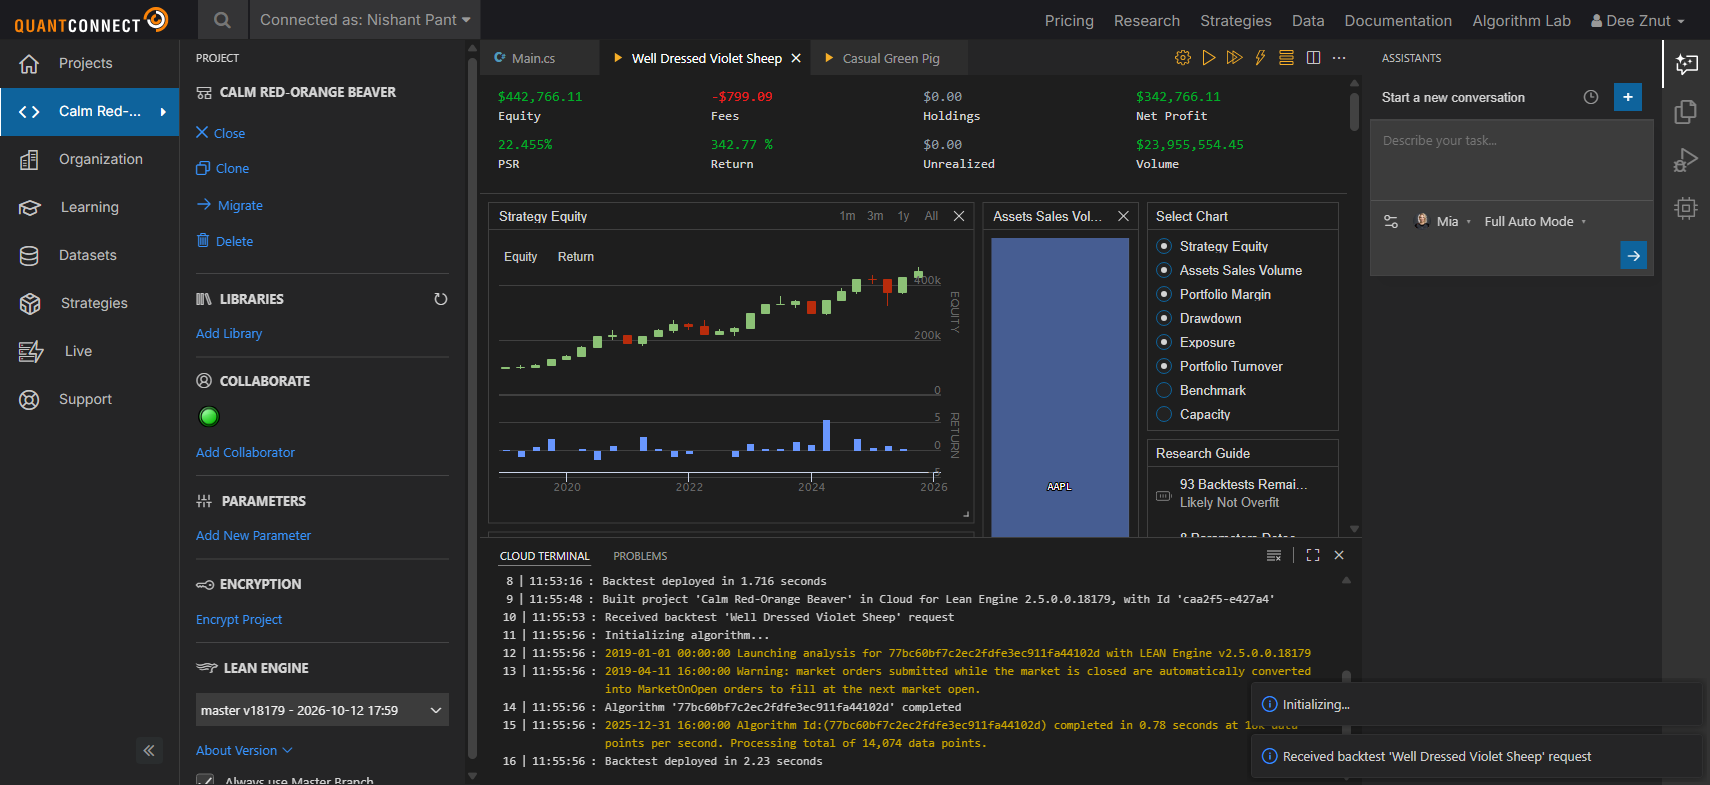
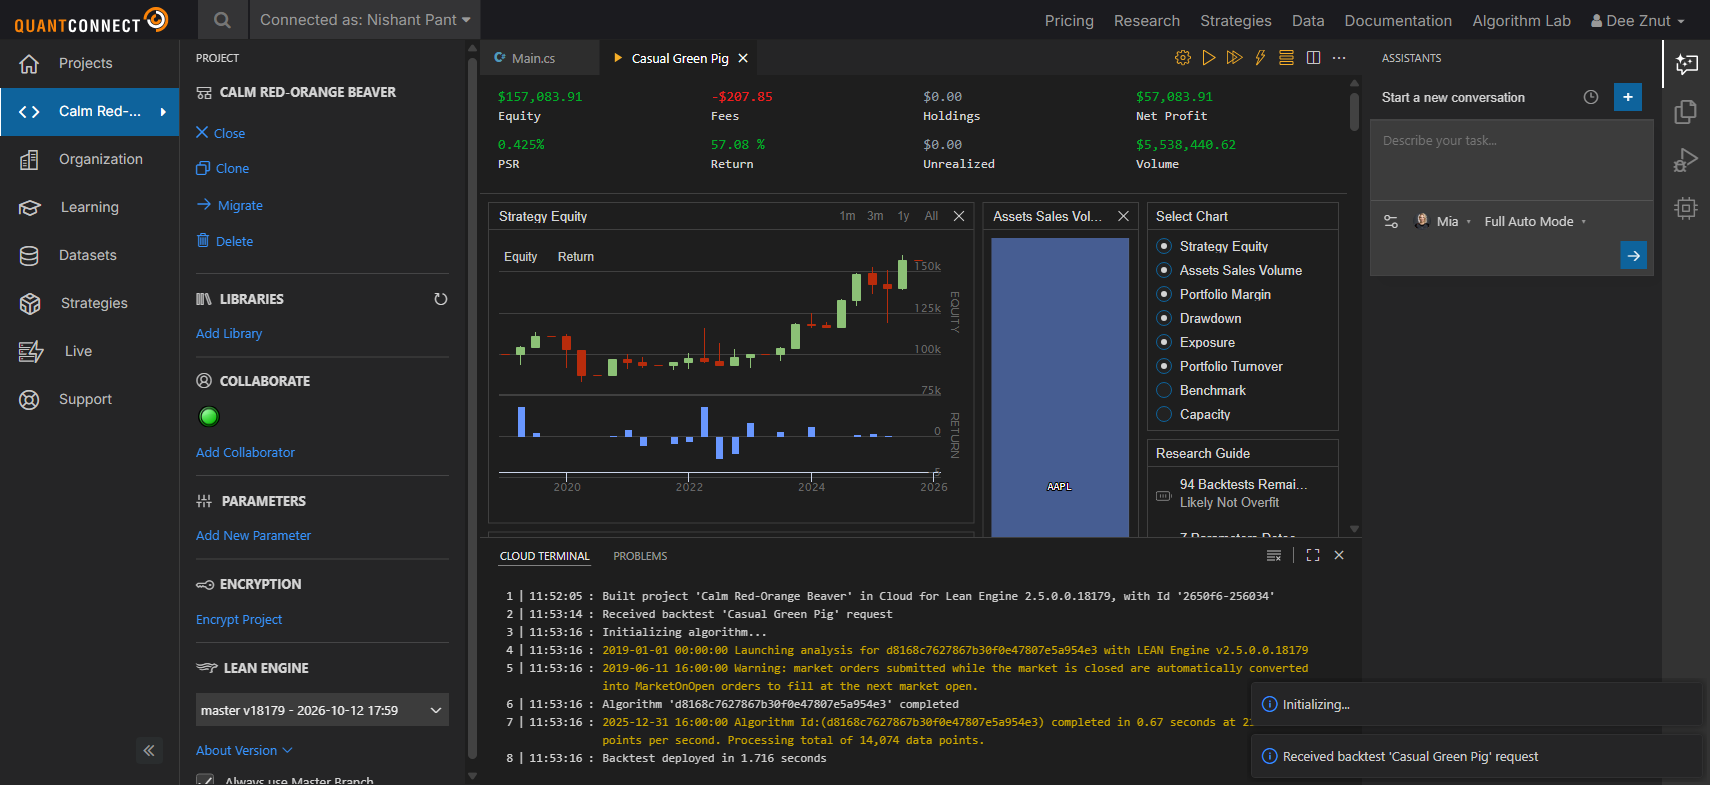
QuantConnect's backtest report for the same rule on AAPL.
QuantConnect's backtest report for the same rule on AAPL. Download full size
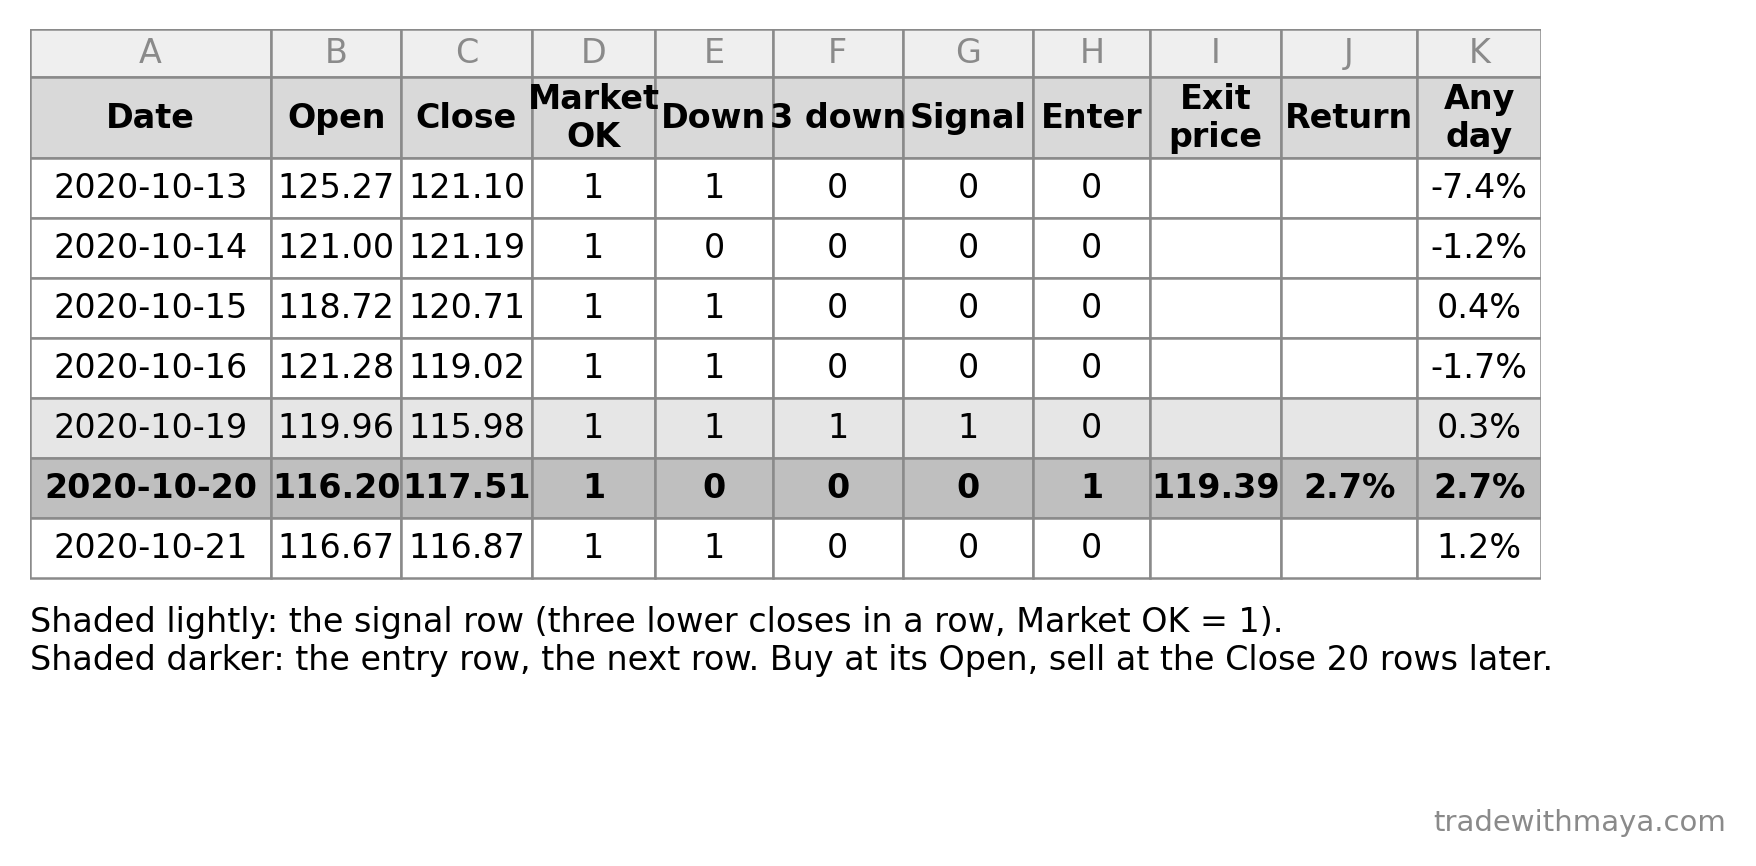
Seven rows of the AAPL tab around one real trade.
Seven rows of the AAPL tab around one real trade. Download full size
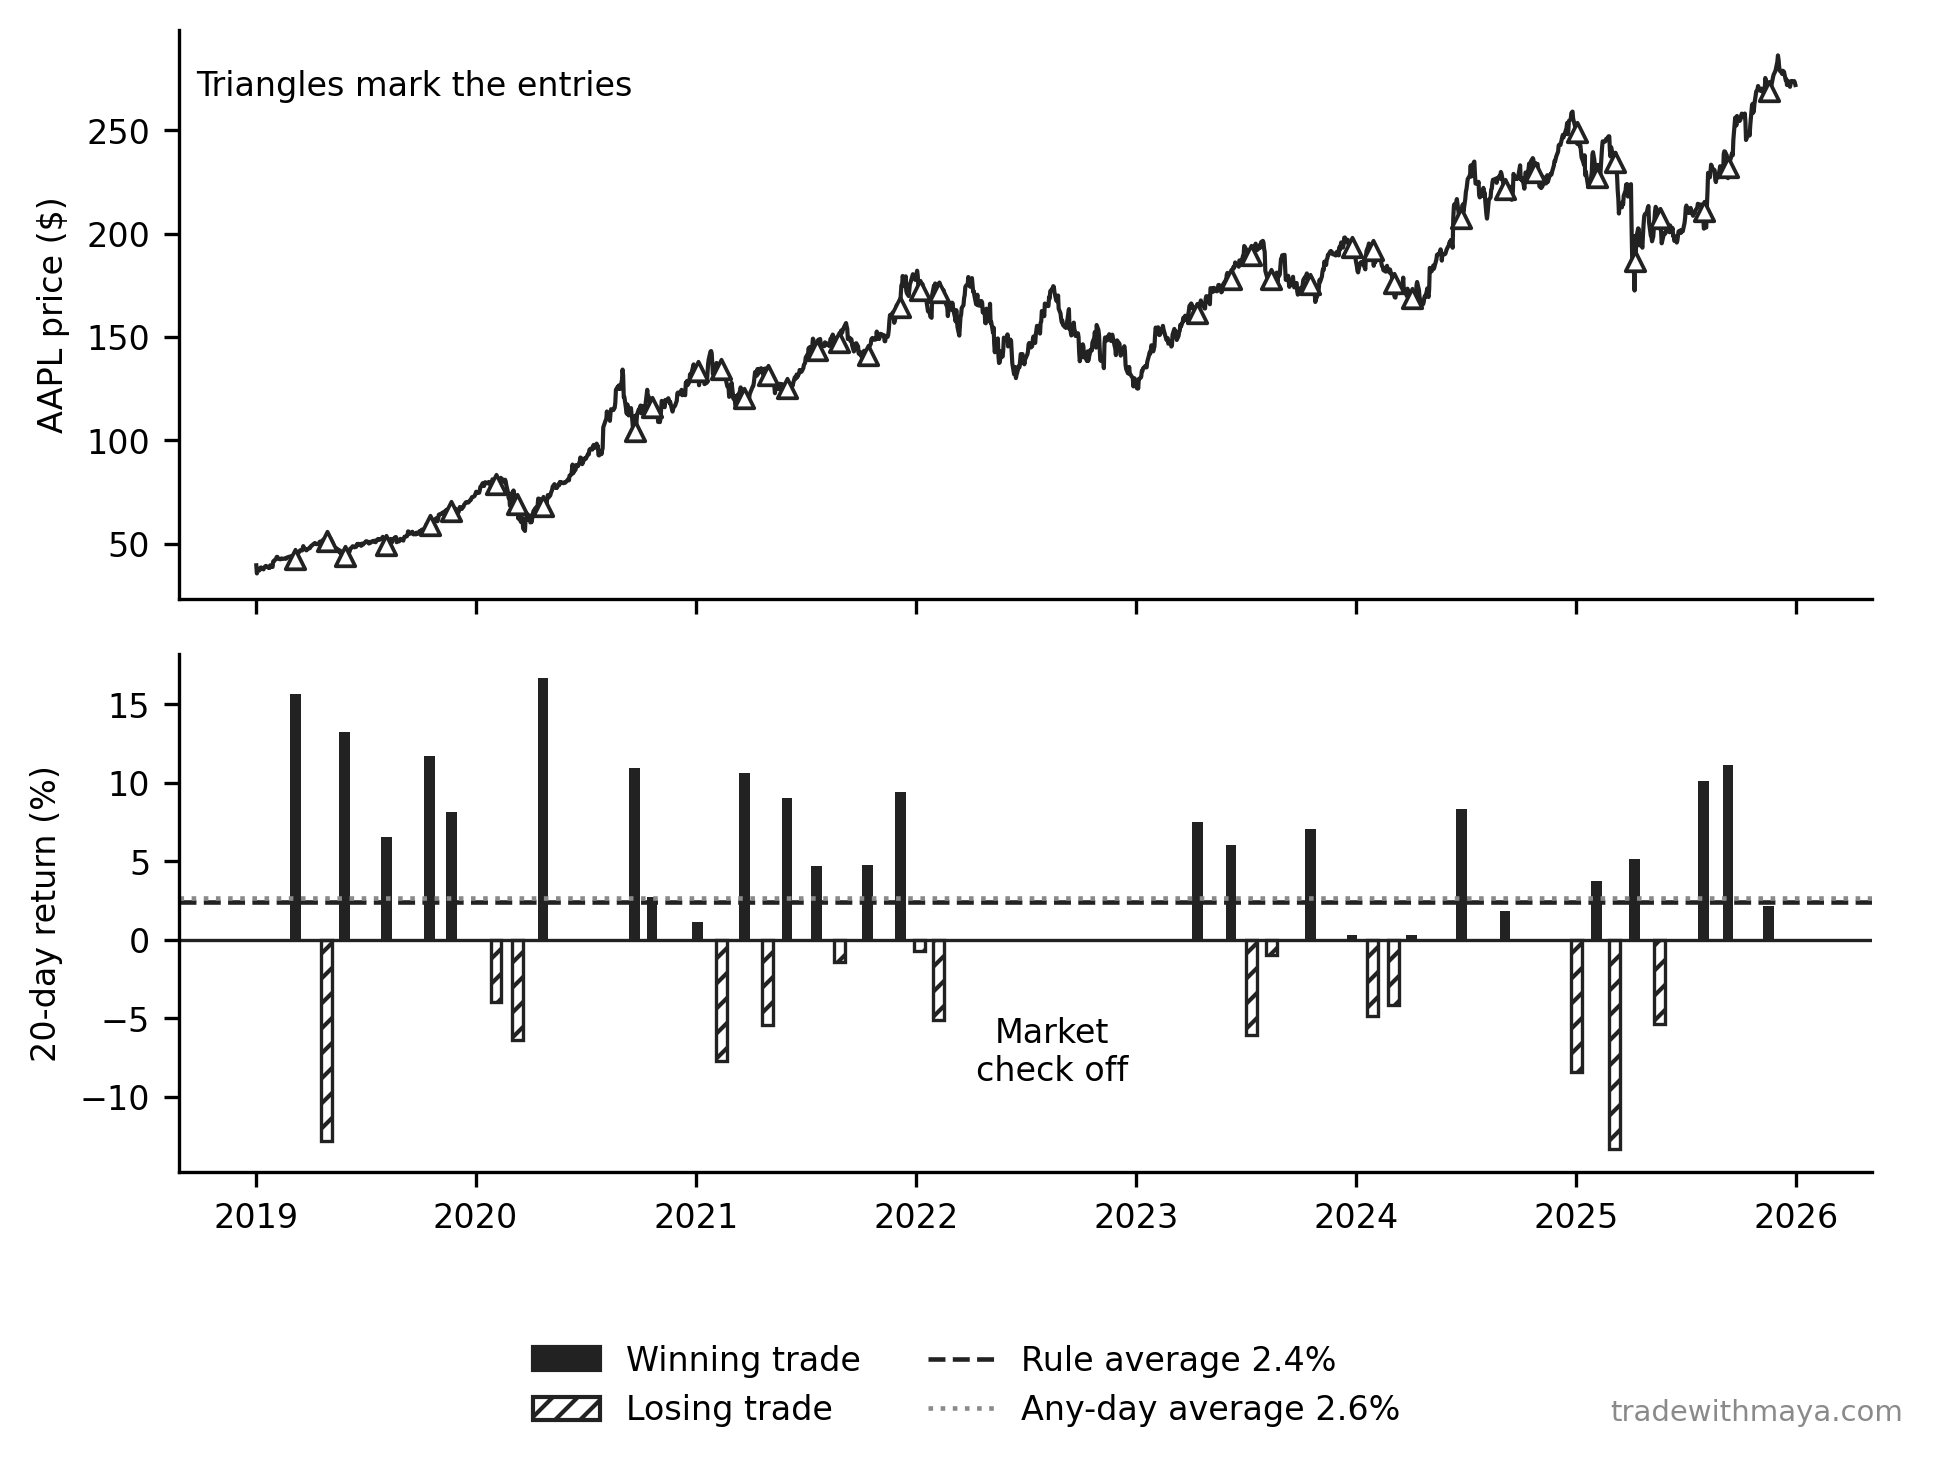
Every AAPL trade from 2019 through 2025.
Every AAPL trade from 2019 through 2025. Download full size
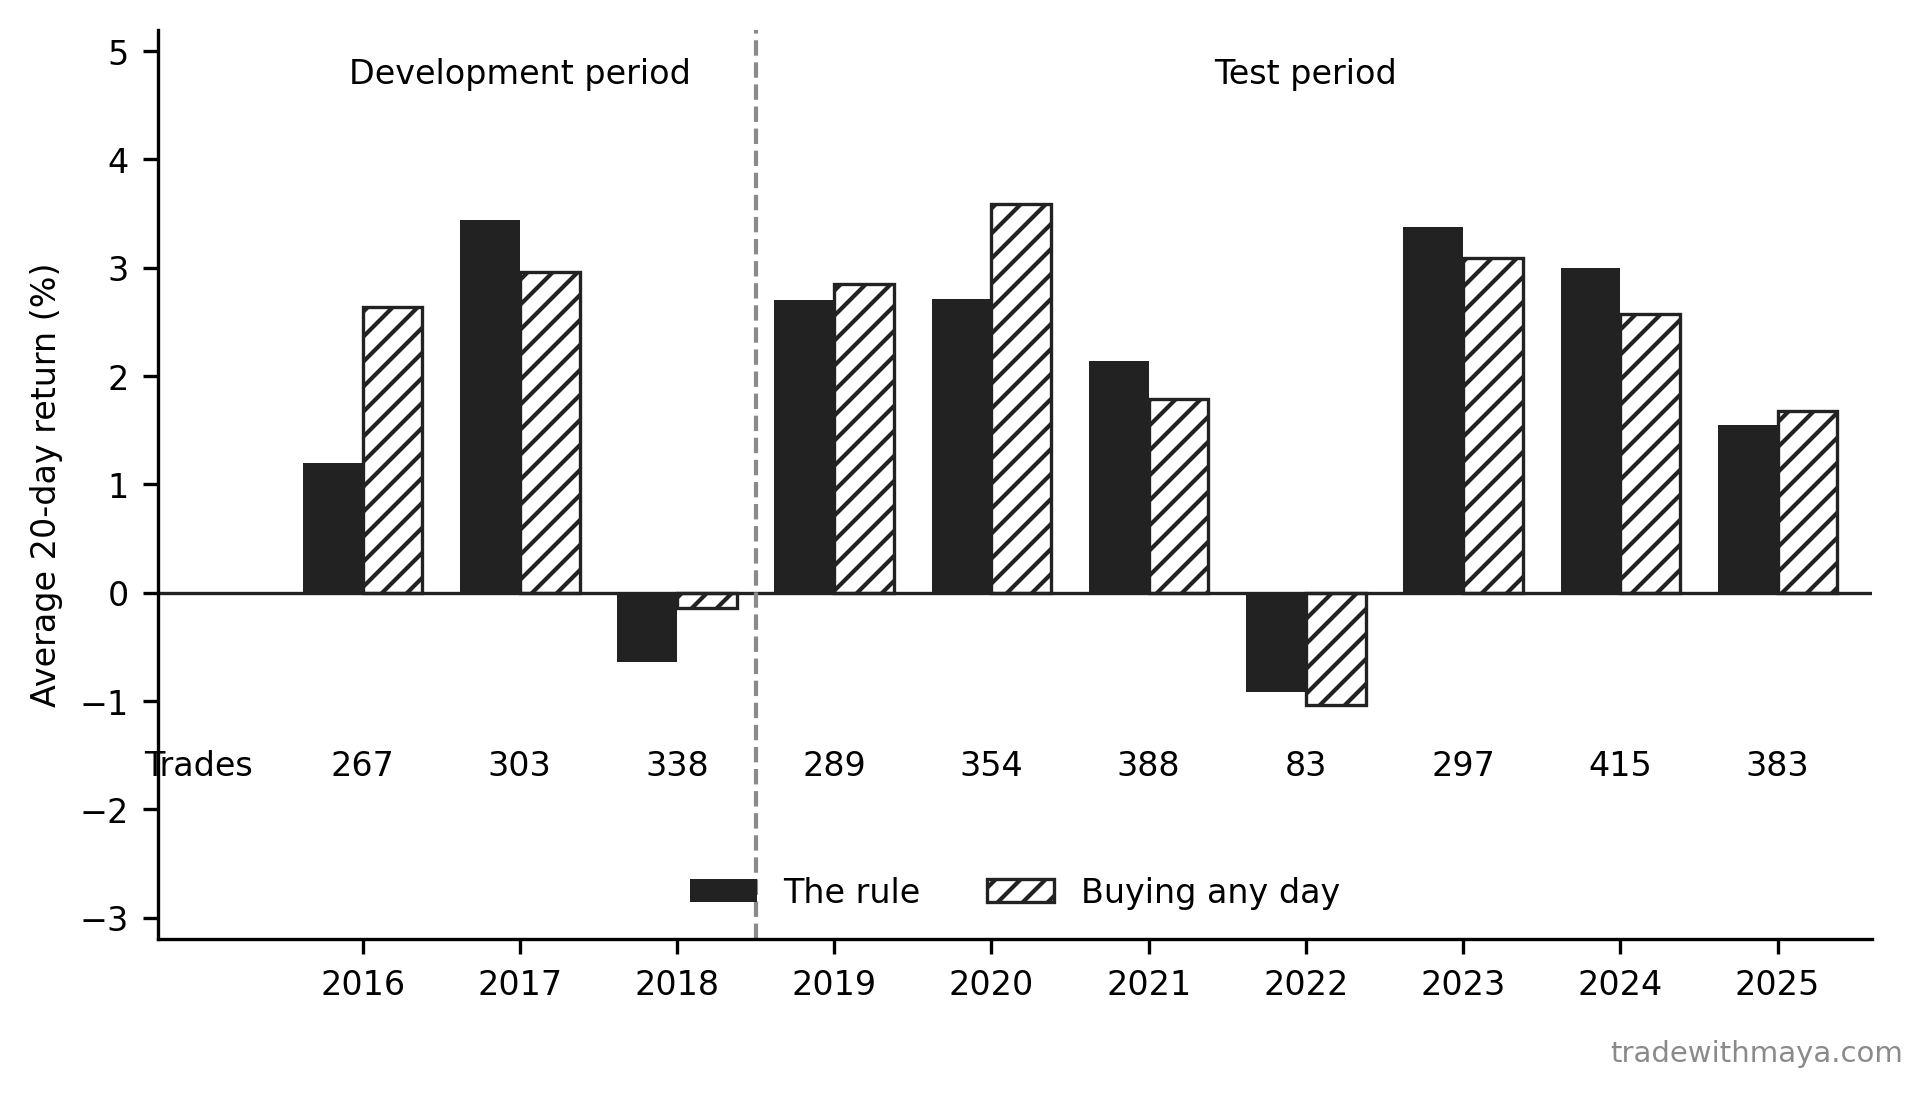
The rule against buying any day, average 20-day return by year.
The rule against buying any day, average 20-day return by year. Download full size
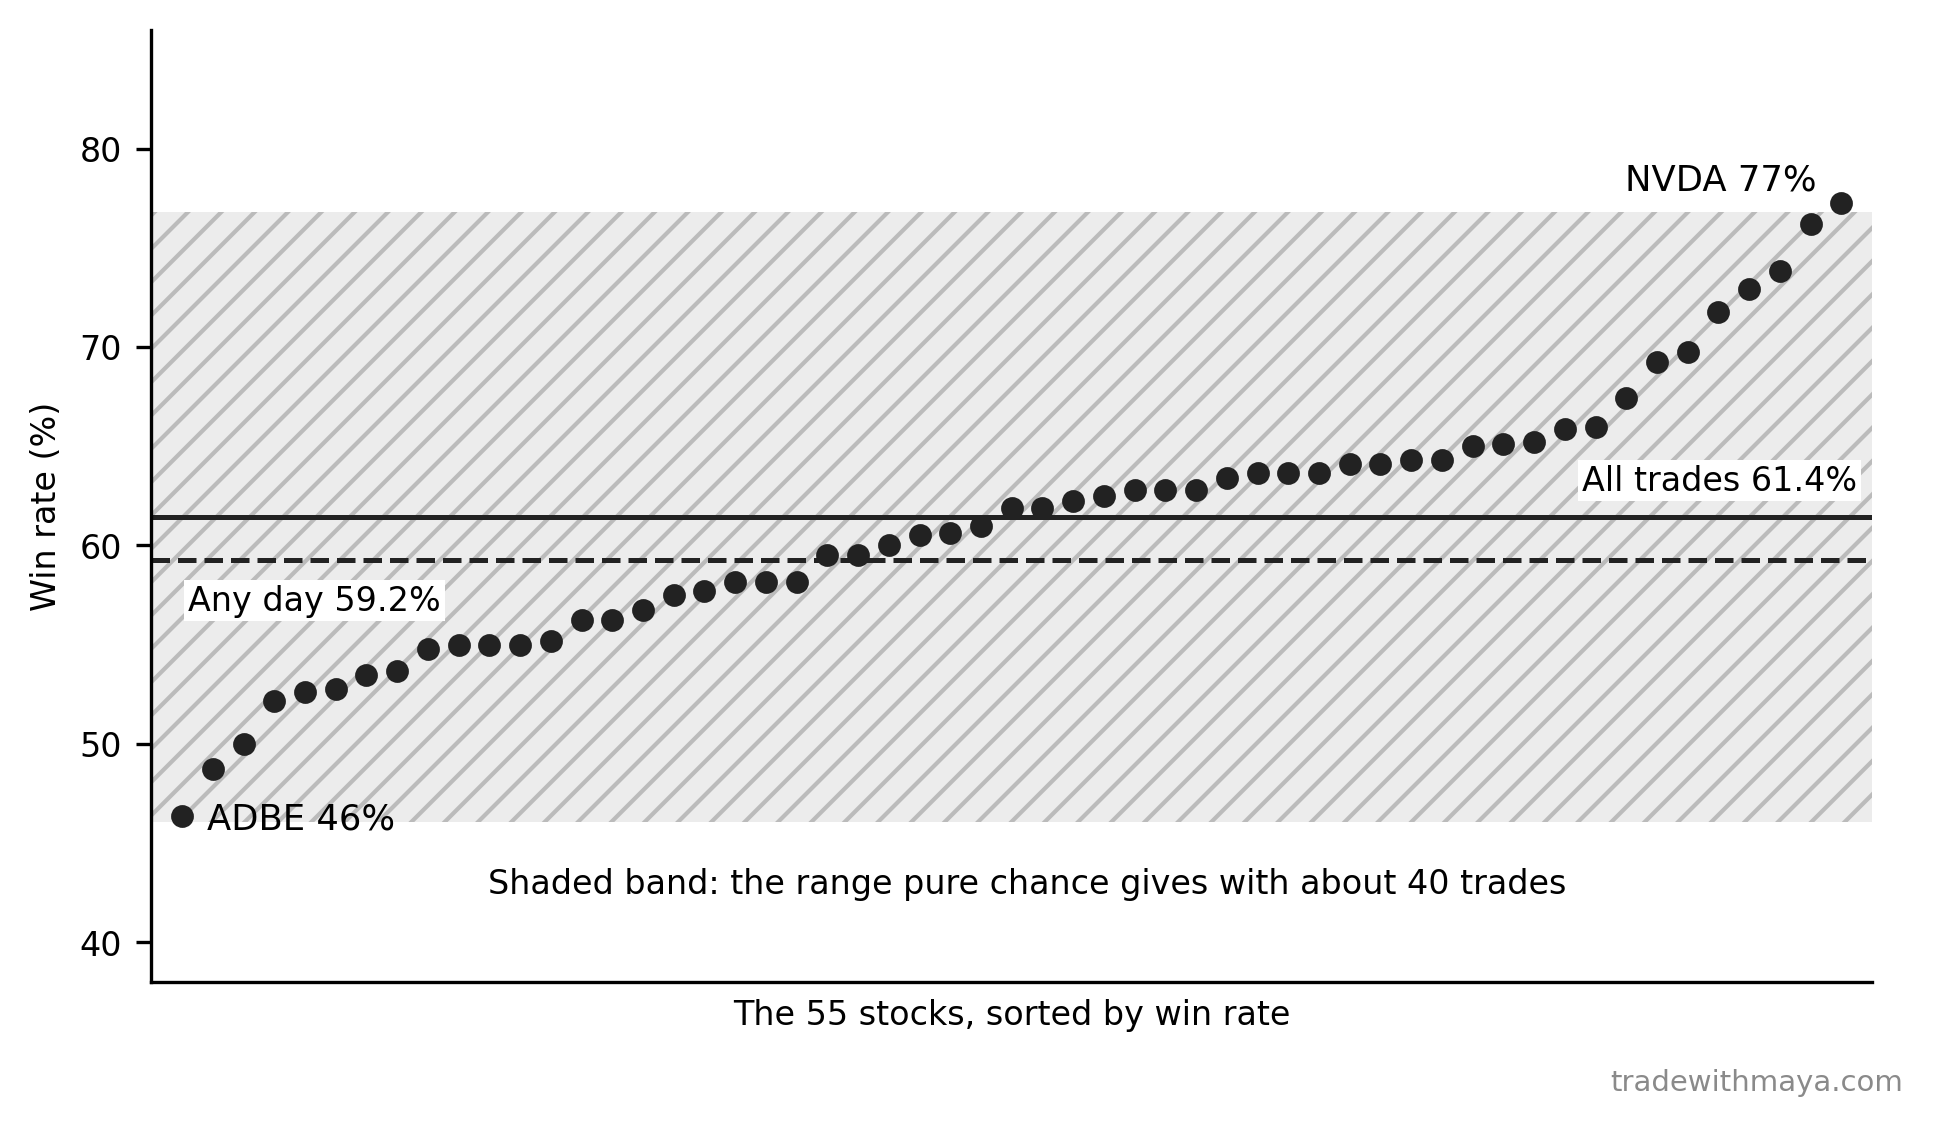
Win rate by stock for the rule, 2019 through 2025, with the stocks sorted from lowest to highest.
Win rate by stock for the rule, 2019 through 2025, with the stocks sorted from lowest to highest. Download full size
TradingView's Strategy Tester running the MACD crossover rule on real AAPL data.
TradingView's Strategy Tester running the MACD crossover rule on real AAPL data. Download full size
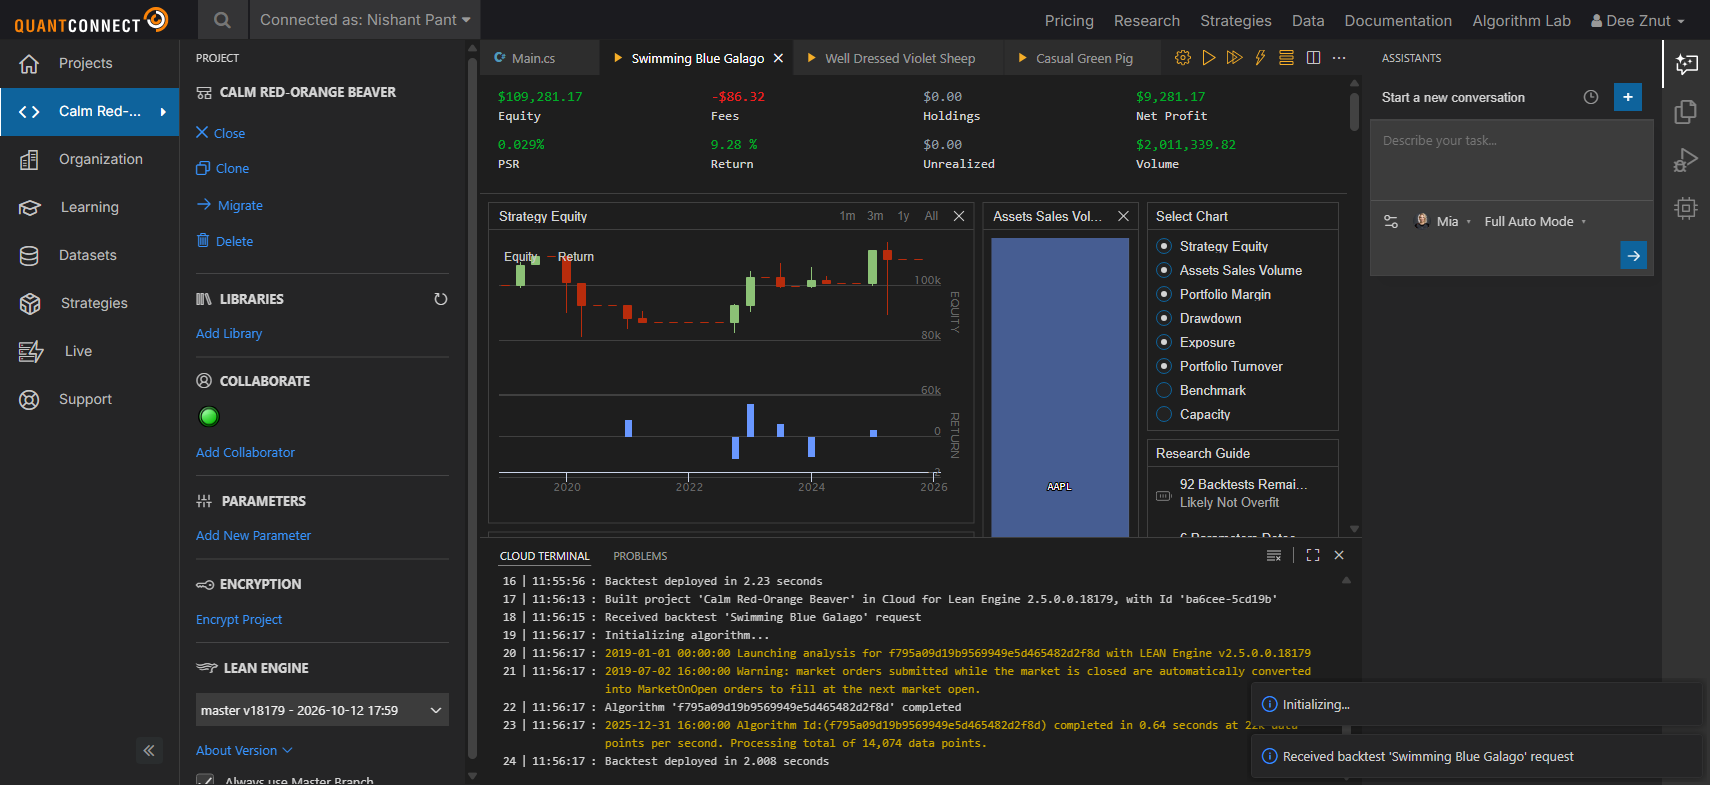
QuantConnect's backtest report for the MACD crossover rule on AAPL.
QuantConnect's backtest report for the MACD crossover rule on AAPL. Download full size
TradingView's Strategy Tester running the RSI oversold bounce rule on real AAPL data.
TradingView's Strategy Tester running the RSI oversold bounce rule on real AAPL data. Download full size
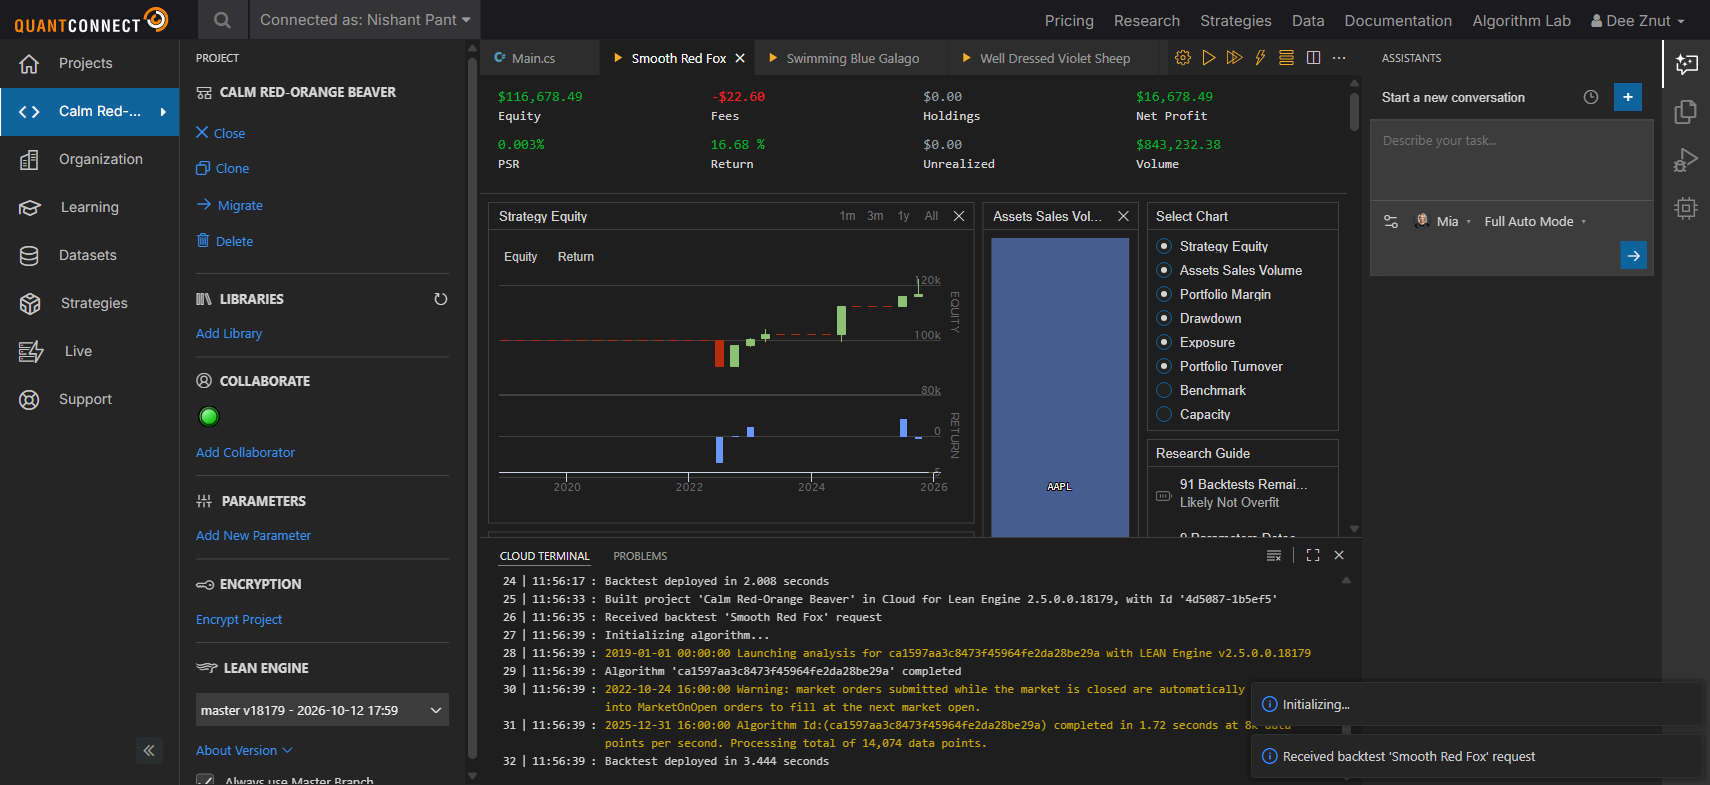
QuantConnect's backtest report for the RSI oversold bounce rule on AAPL.
QuantConnect's backtest report for the RSI oversold bounce rule on AAPL. Download full size
TradingView's Strategy Tester running the golden cross rule on real AAPL data.
TradingView's Strategy Tester running the golden cross rule on real AAPL data. Download full size
QuantConnect's backtest report for the golden cross rule on AAPL.
QuantConnect's backtest report for the golden cross rule on AAPL. Download full size
TradingView's Strategy Tester running the Bollinger Band touch rule on real AAPL data.
TradingView's Strategy Tester running the Bollinger Band touch rule on real AAPL data. Download full size
QuantConnect's backtest report for the Bollinger Band touch rule on AAPL.
QuantConnect's backtest report for the Bollinger Band touch rule on AAPL. Download full size
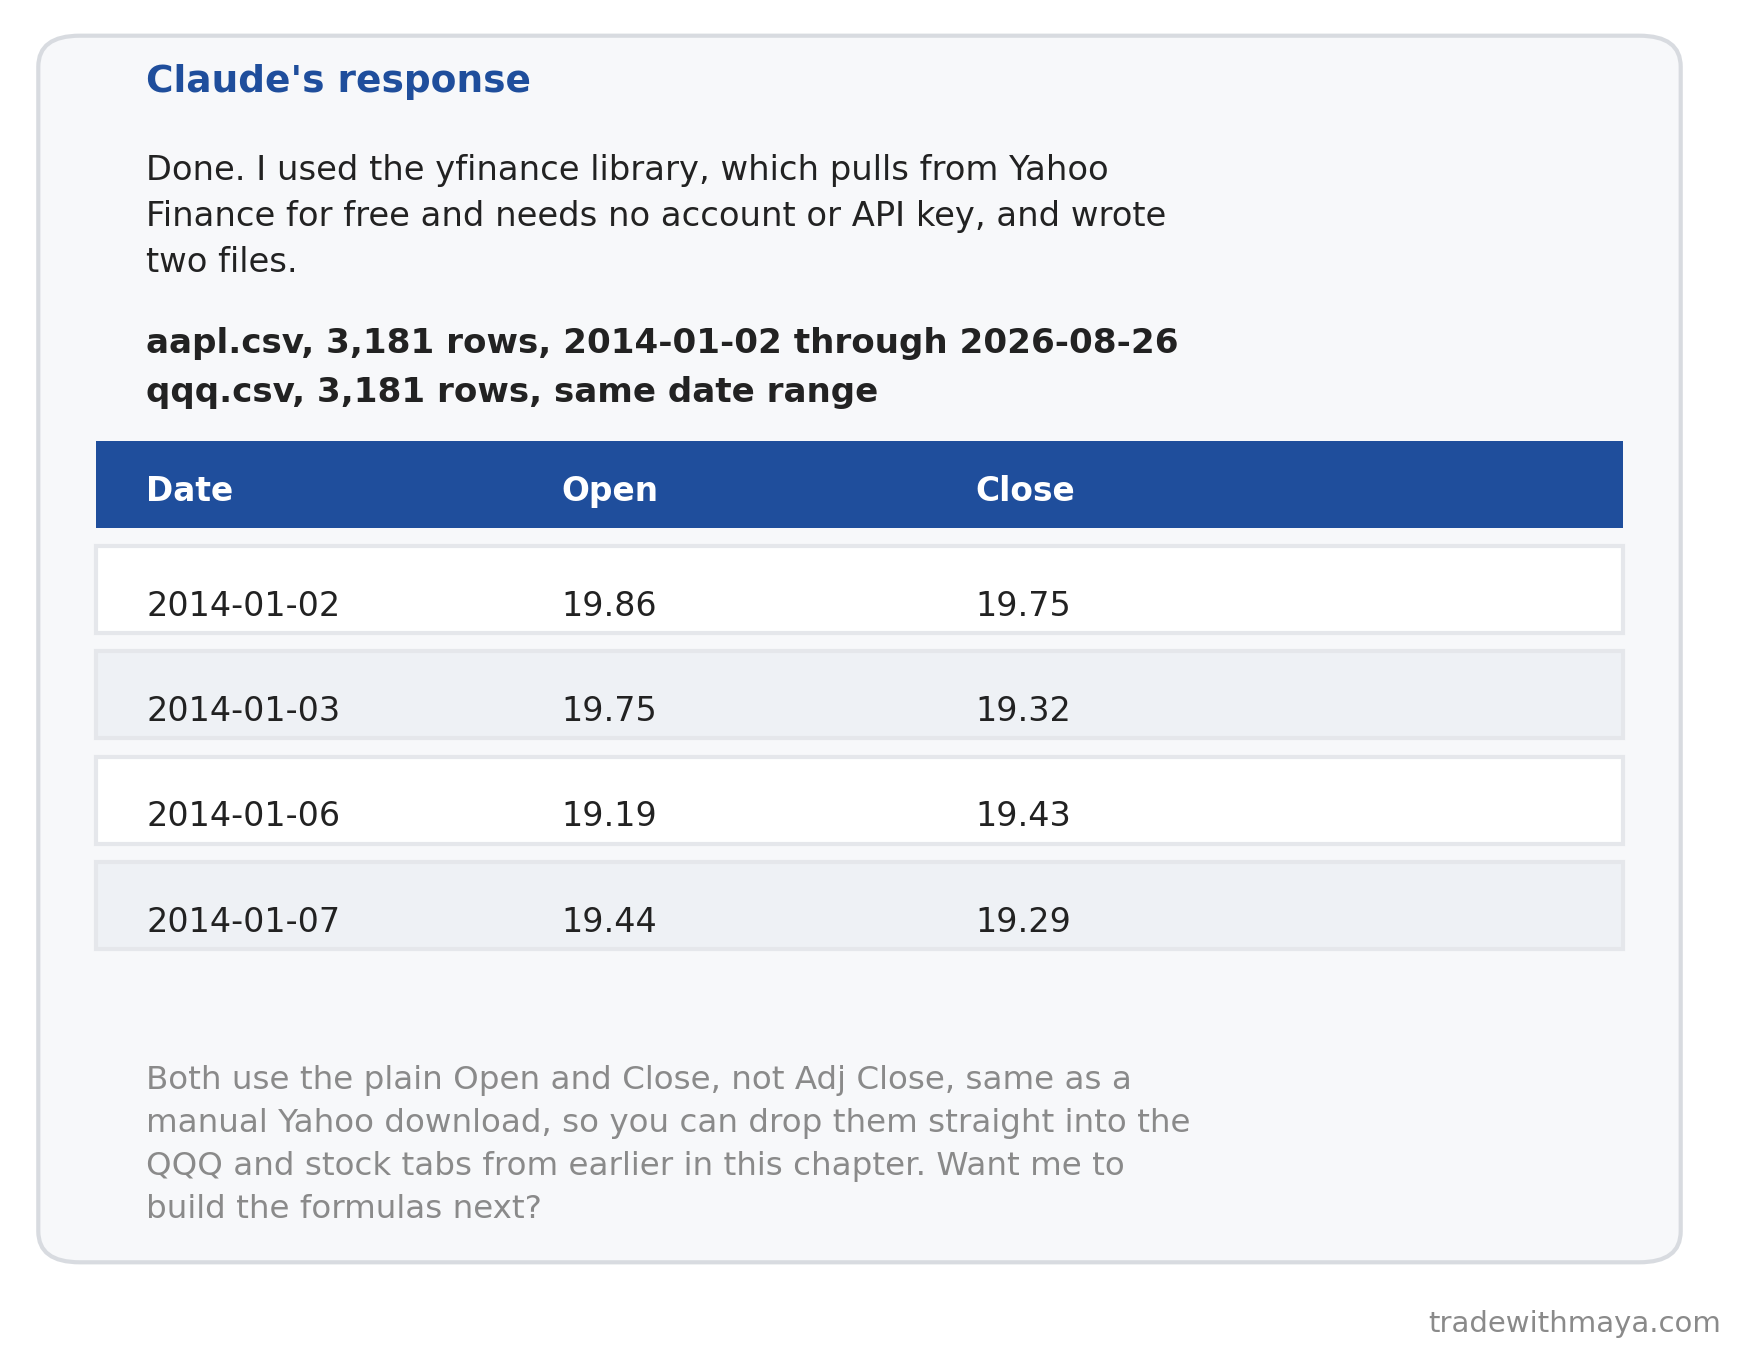
Claude's response to the data-fetching prompt, pulling real AAPL and QQQ history and saving it as two CSV files.
Claude's response to the data-fetching prompt, pulling real AAPL and QQQ history and saving it as two CSV files. Download full size
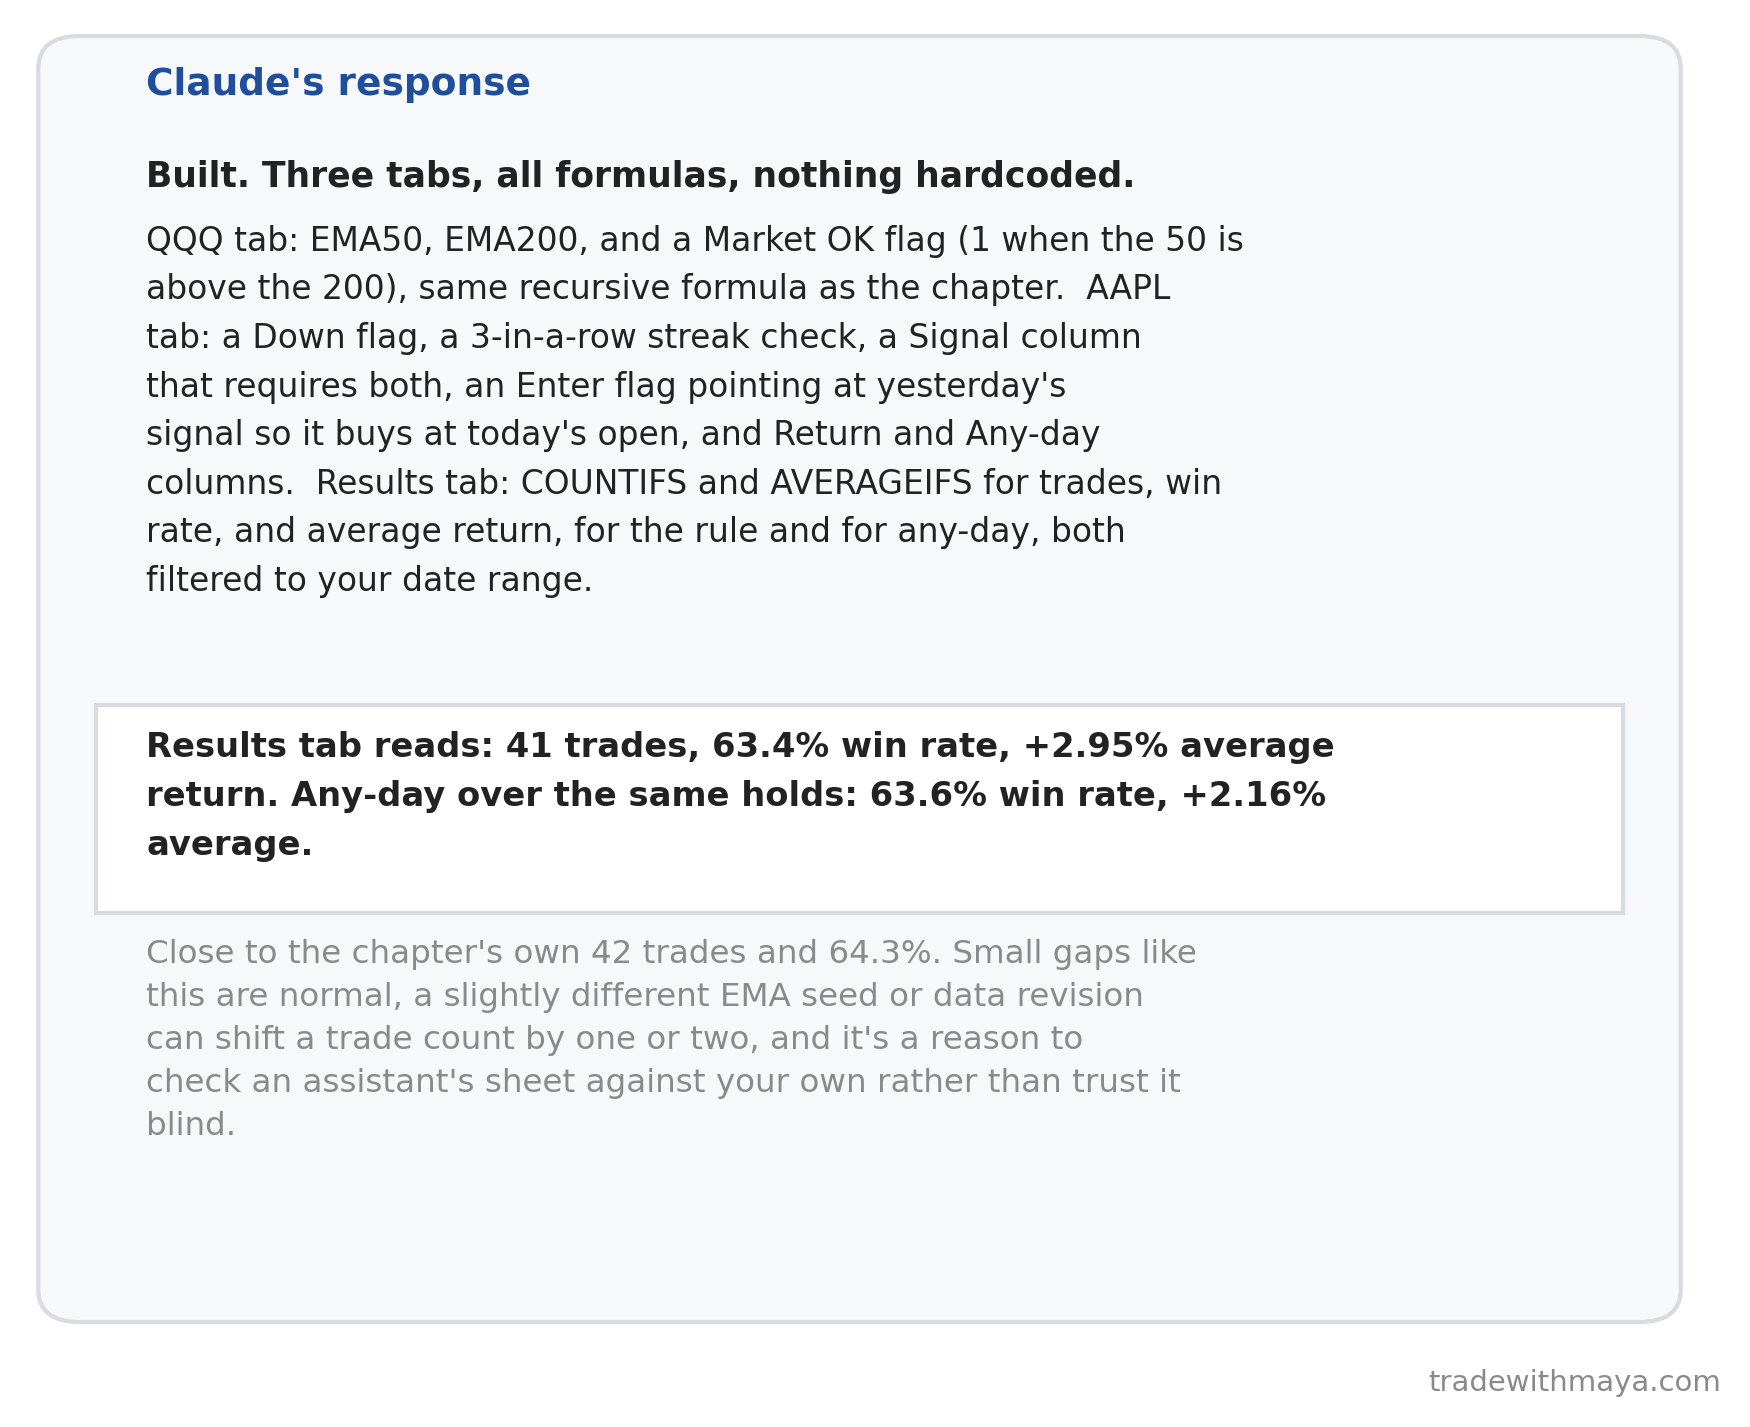
Claude's response, building the three tabs with real formulas and reporting what the results tab shows.
Claude's response, building the three tabs with real formulas and reporting what the results tab shows. Download full size
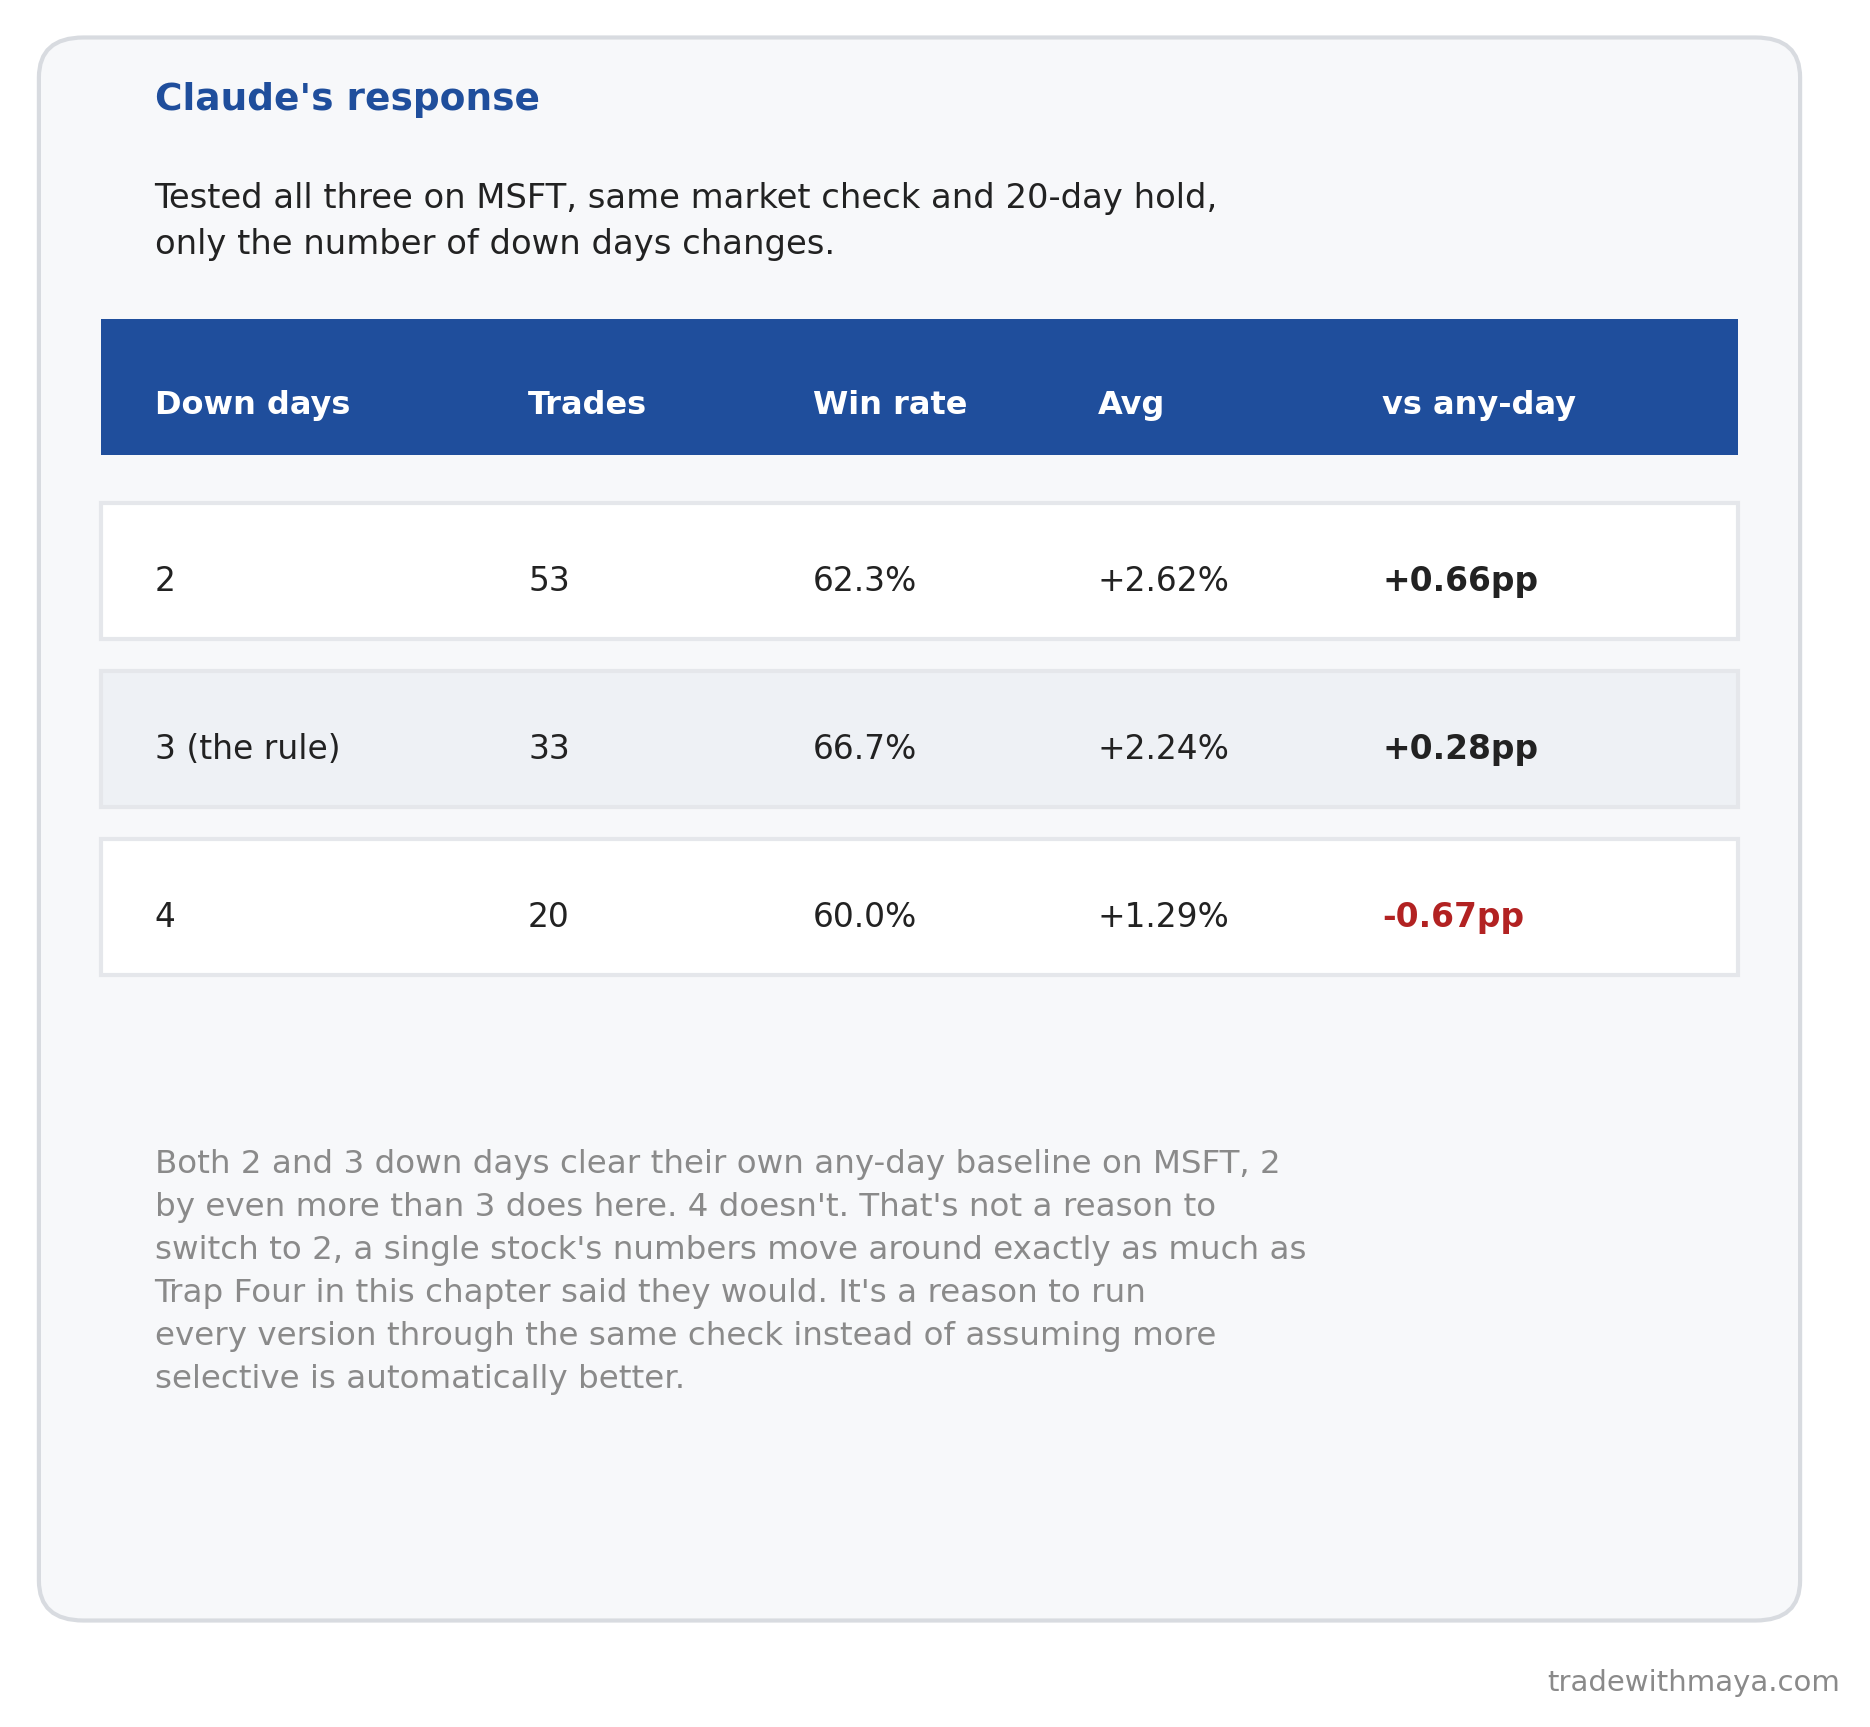
Claude's response, testing three versions of the down-day count against the any-day baseline on real data.
Claude's response, testing three versions of the down-day count against the any-day baseline on real data. Download full size

Chapter 14: What the Backtests Actually ShowBack to top
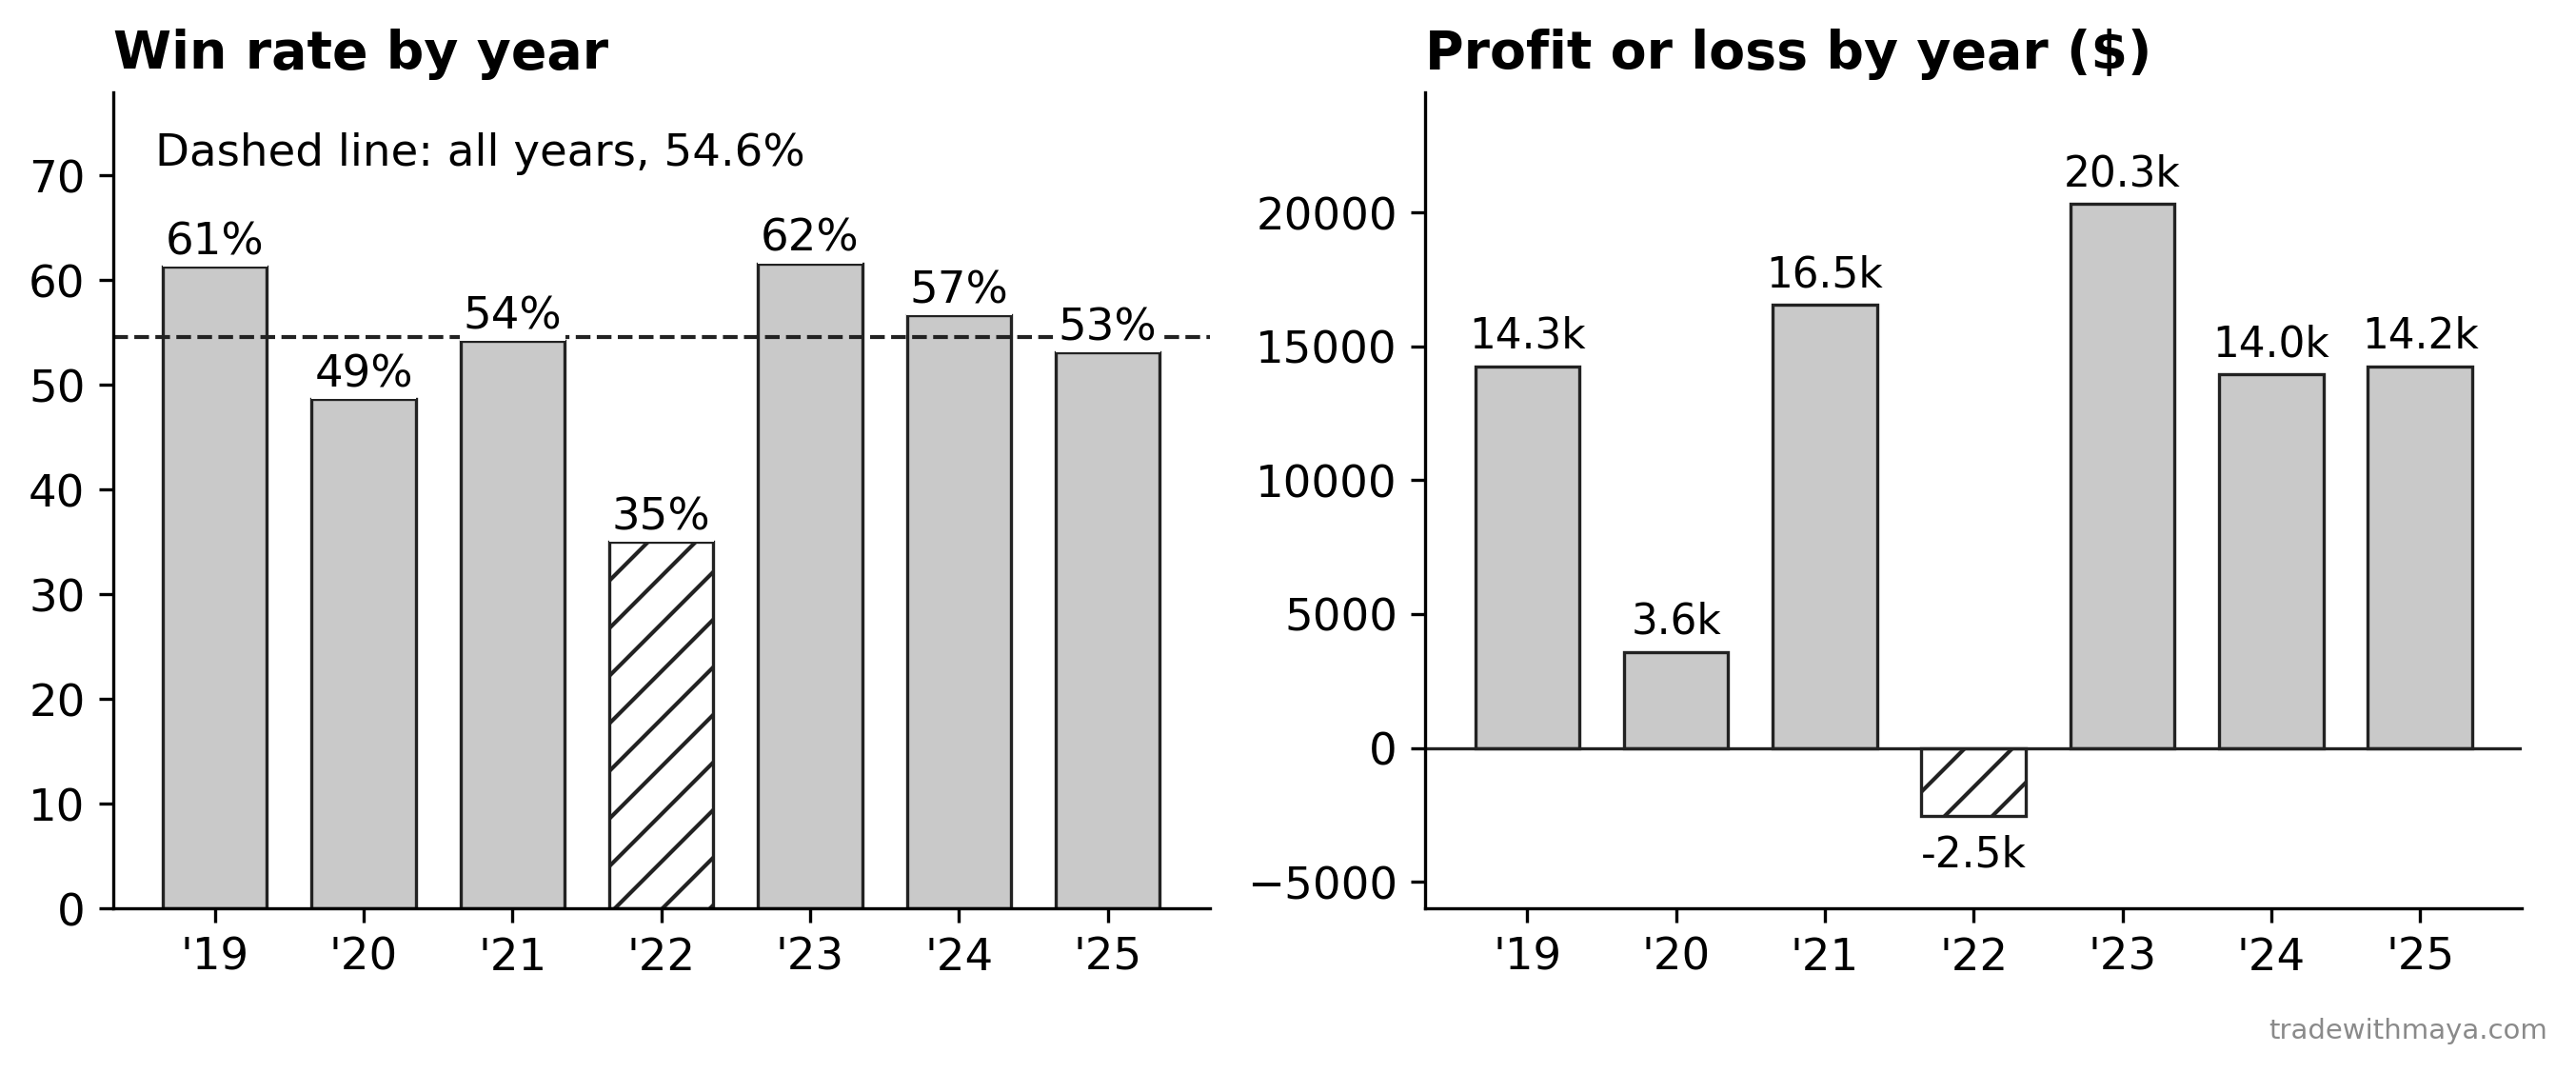
Win rate and net result by year for the 2,361 trades in our 2019 to 2025 backtest.
Win rate and net result by year for the 2,361 trades in our 2019 to 2025 backtest. Download full size
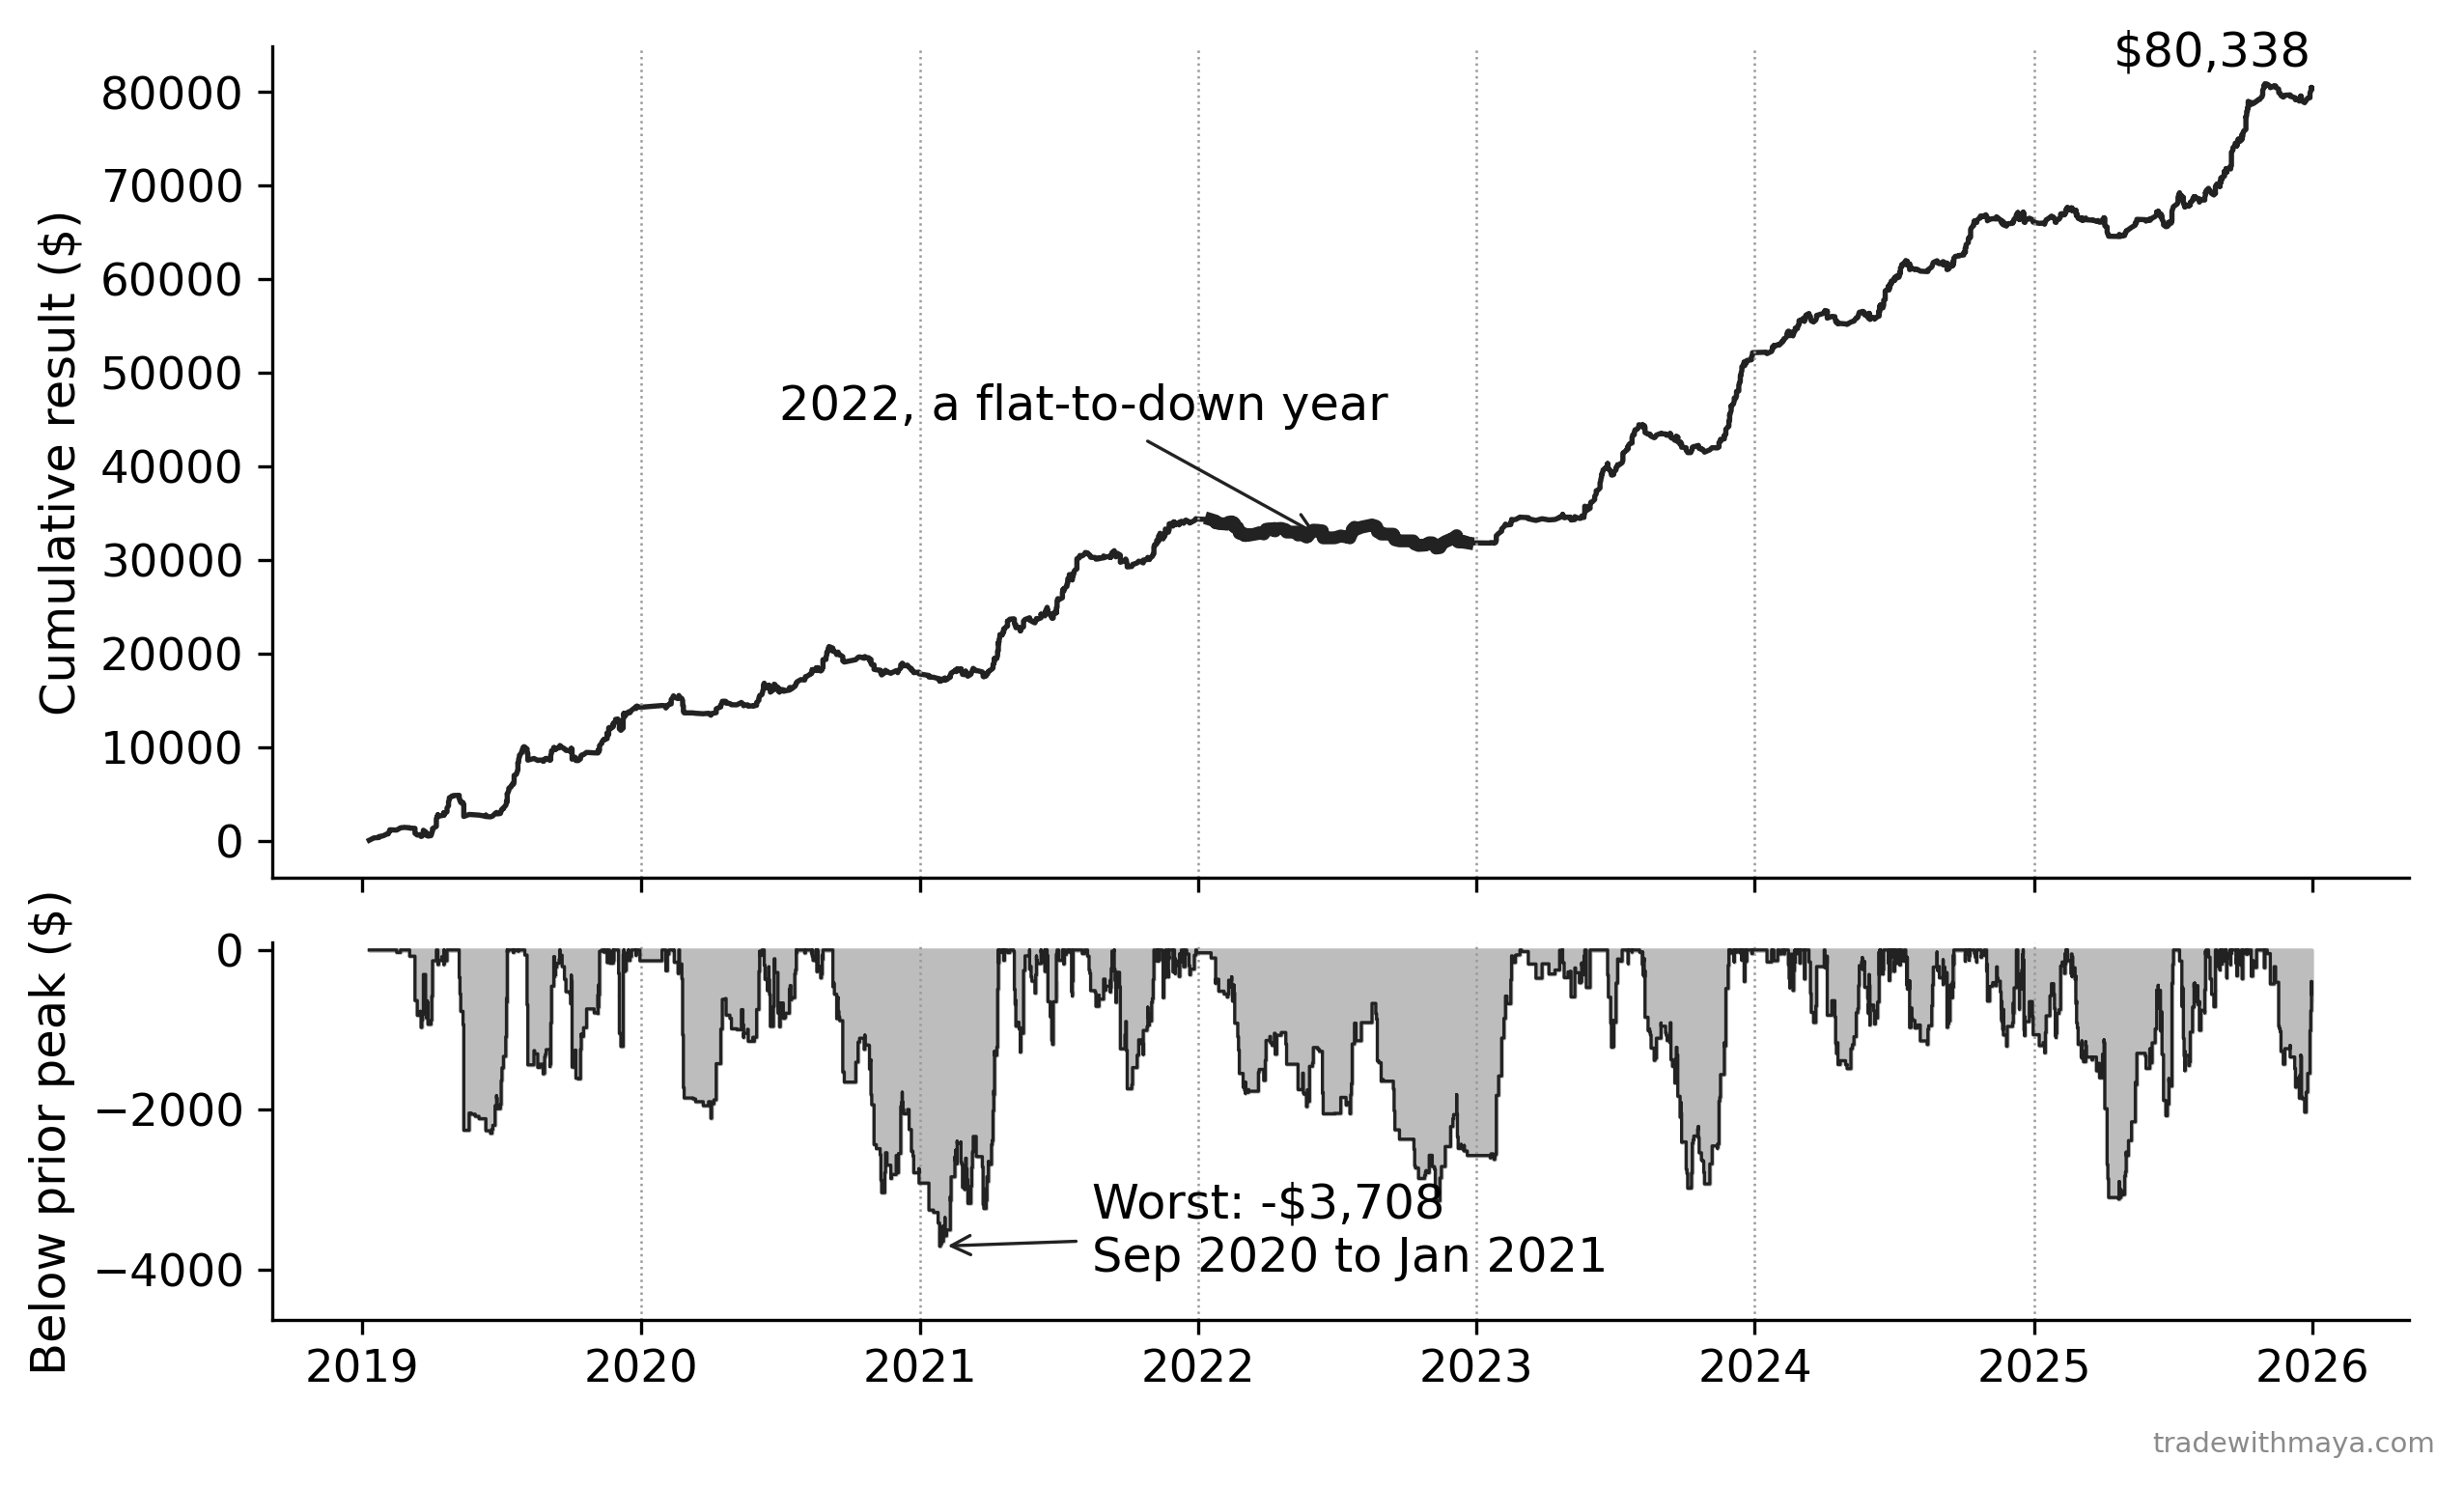
Cumulative result of the 2,361 trades in the order they closed, with the drawdown from the prior peak underneath.
Cumulative result of the 2,361 trades in the order they closed, with the drawdown from the prior peak underneath. Download full size
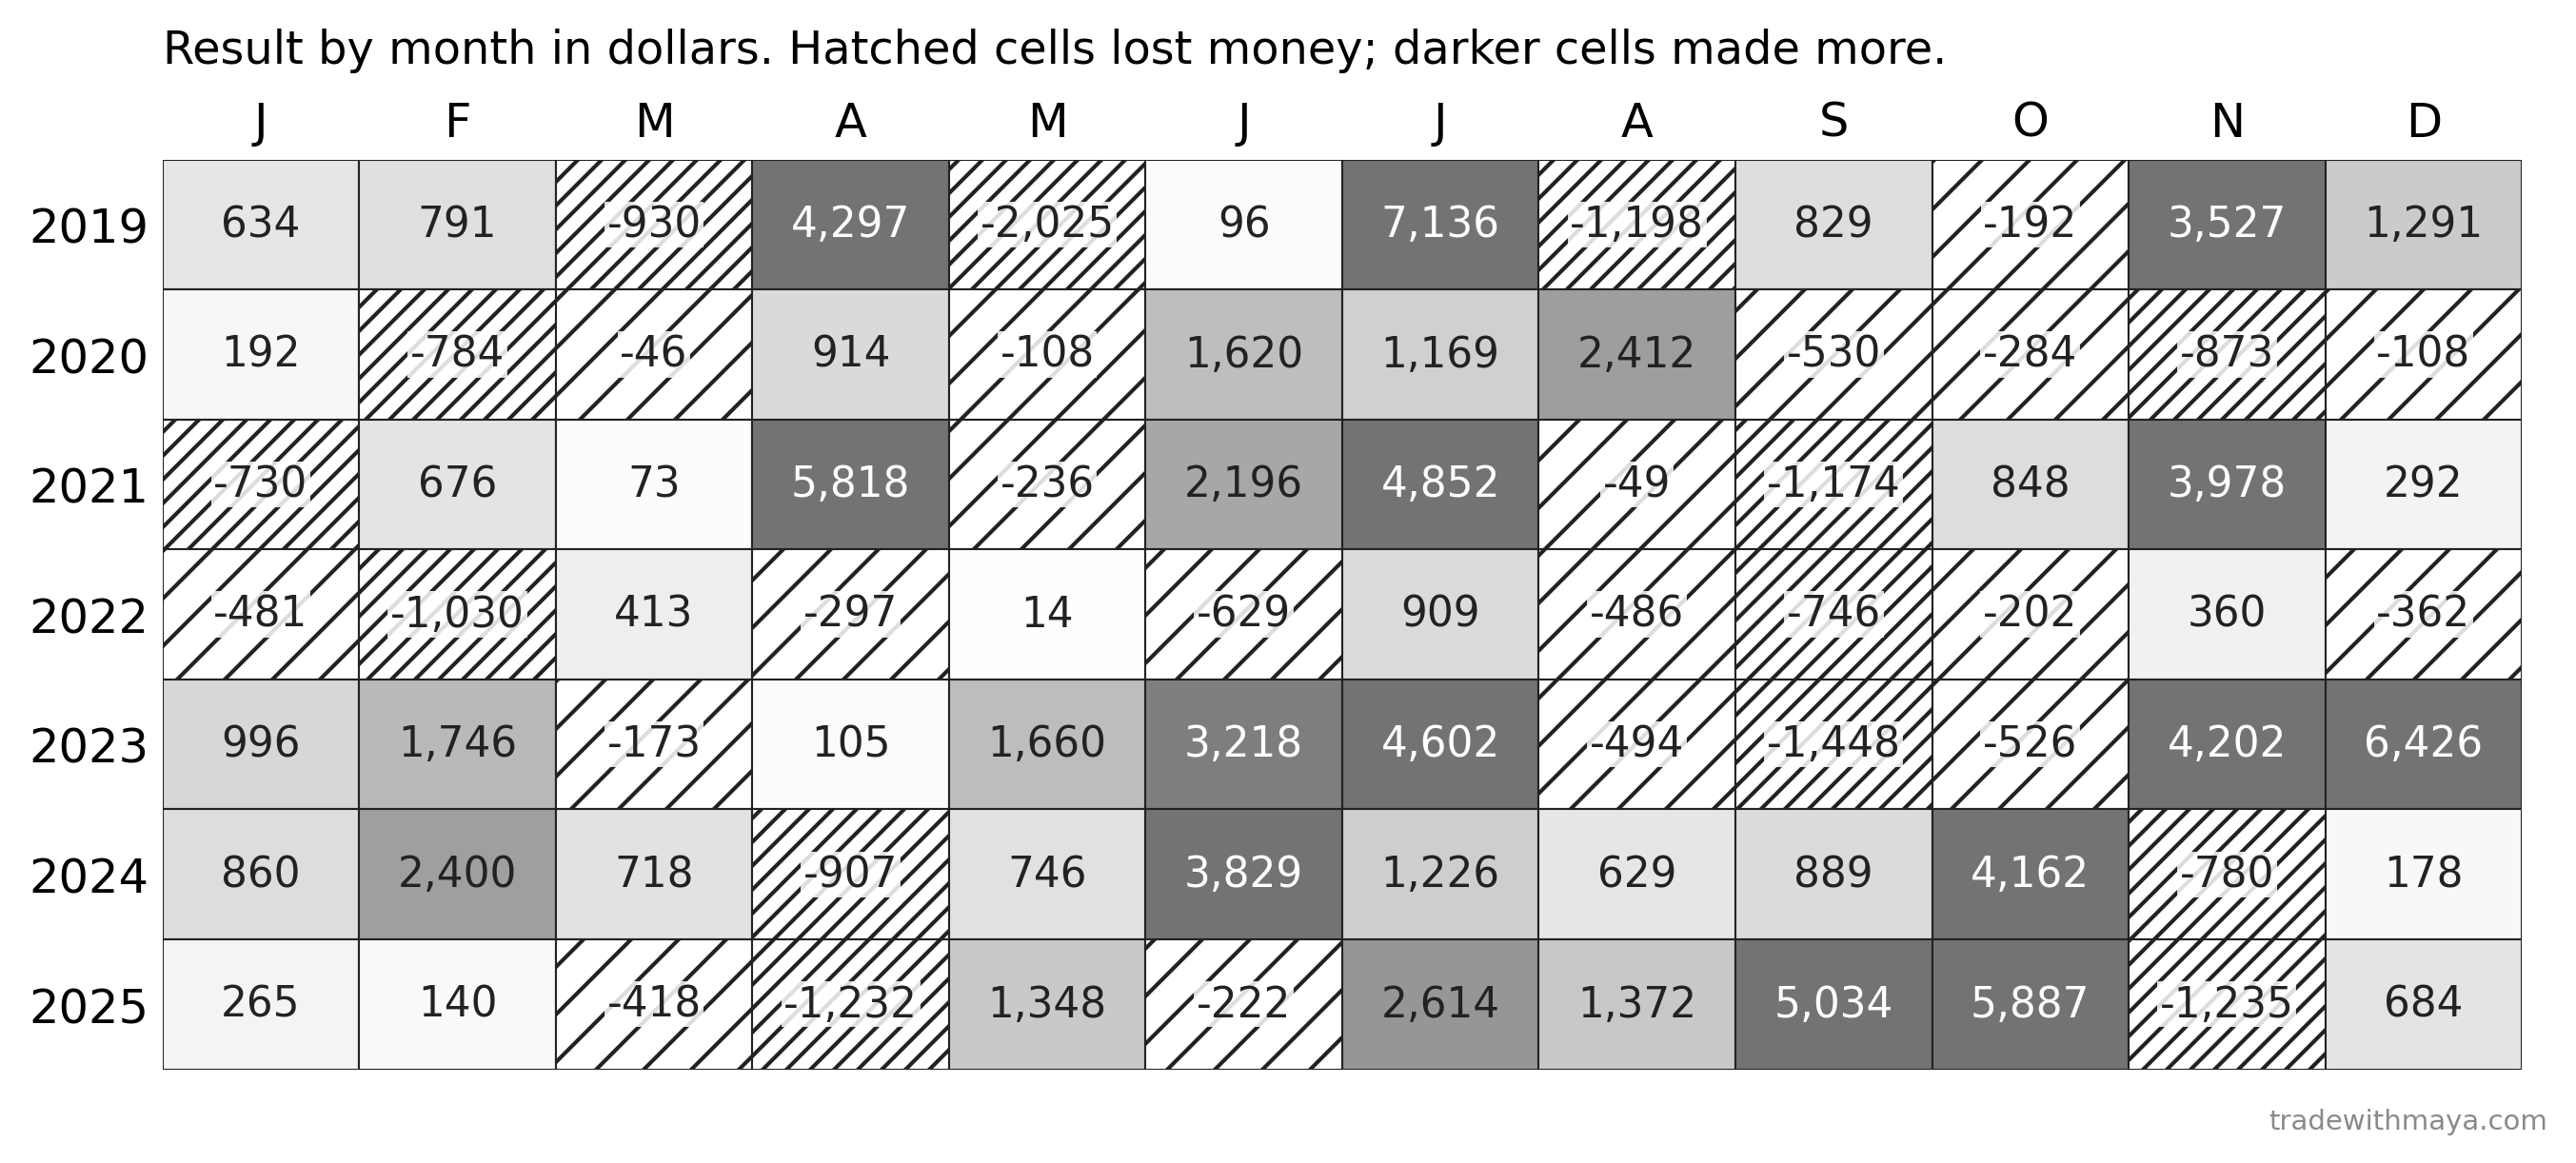
Monthly net result for each year, in dollars.
Monthly net result for each year, in dollars. Download full size
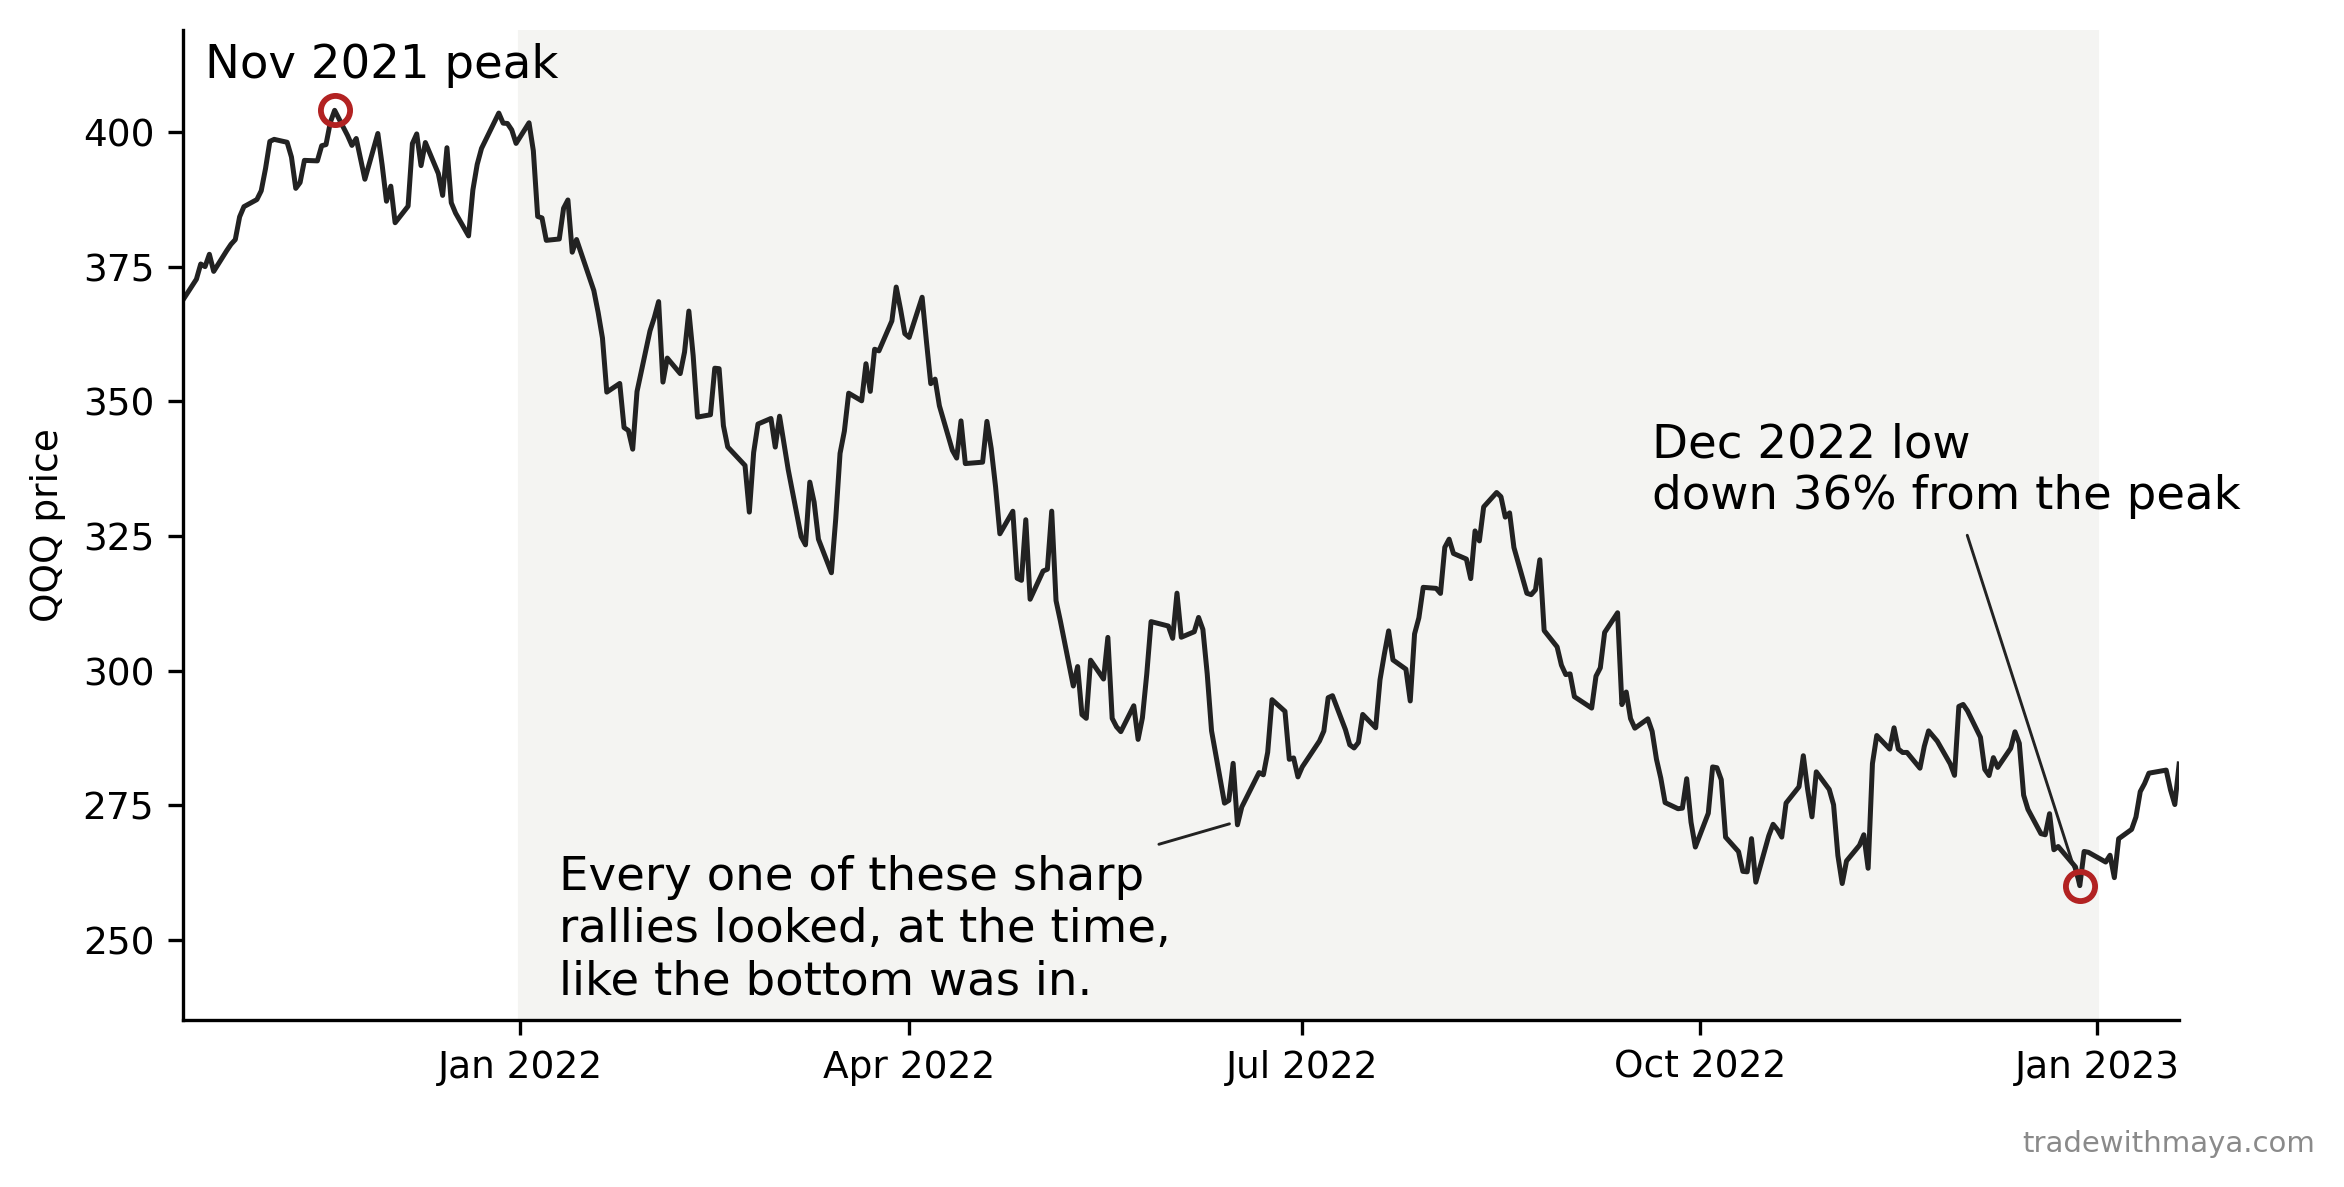
QQQ from its November 2021 peak through the December 2022 low.
QQQ from its November 2021 peak through the December 2022 low. Download full size

Chapter 16: A Signal Is Not a SystemBack to top
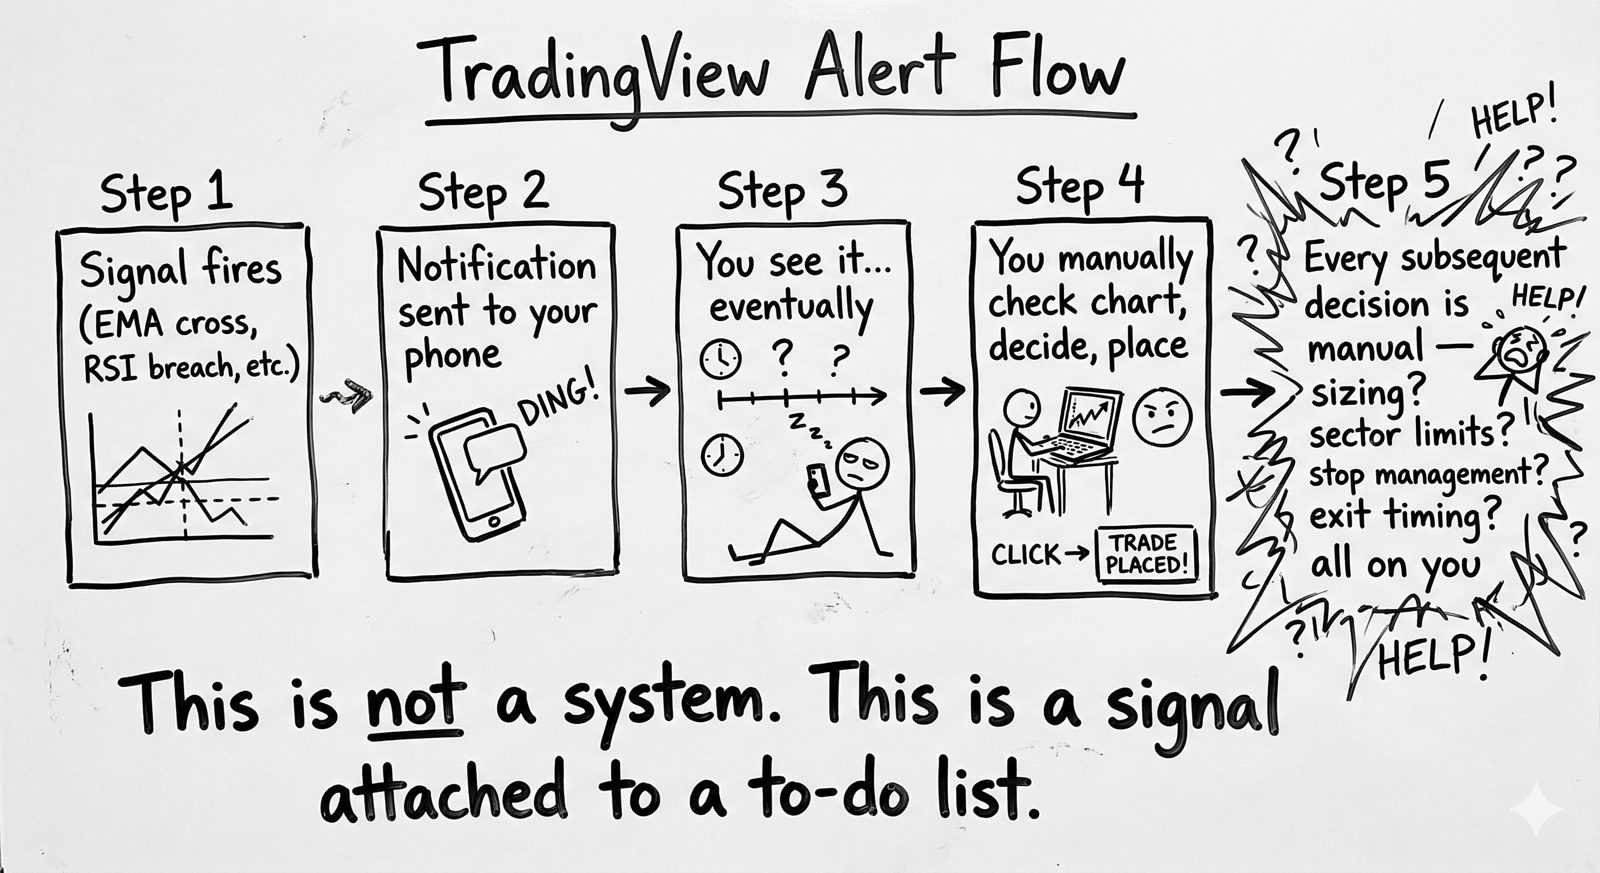
A whiteboard titled TradingView Alert Flow showing five steps: a signal fires, a notification pings your phone, you see it eventually while half asleep, you manually check the chart and decide and...
A whiteboard titled TradingView Alert Flow showing five steps: a signal fires, a notification pings your phone, you see it eventually while half asleep, you manually check the chart and decide and... Download full size
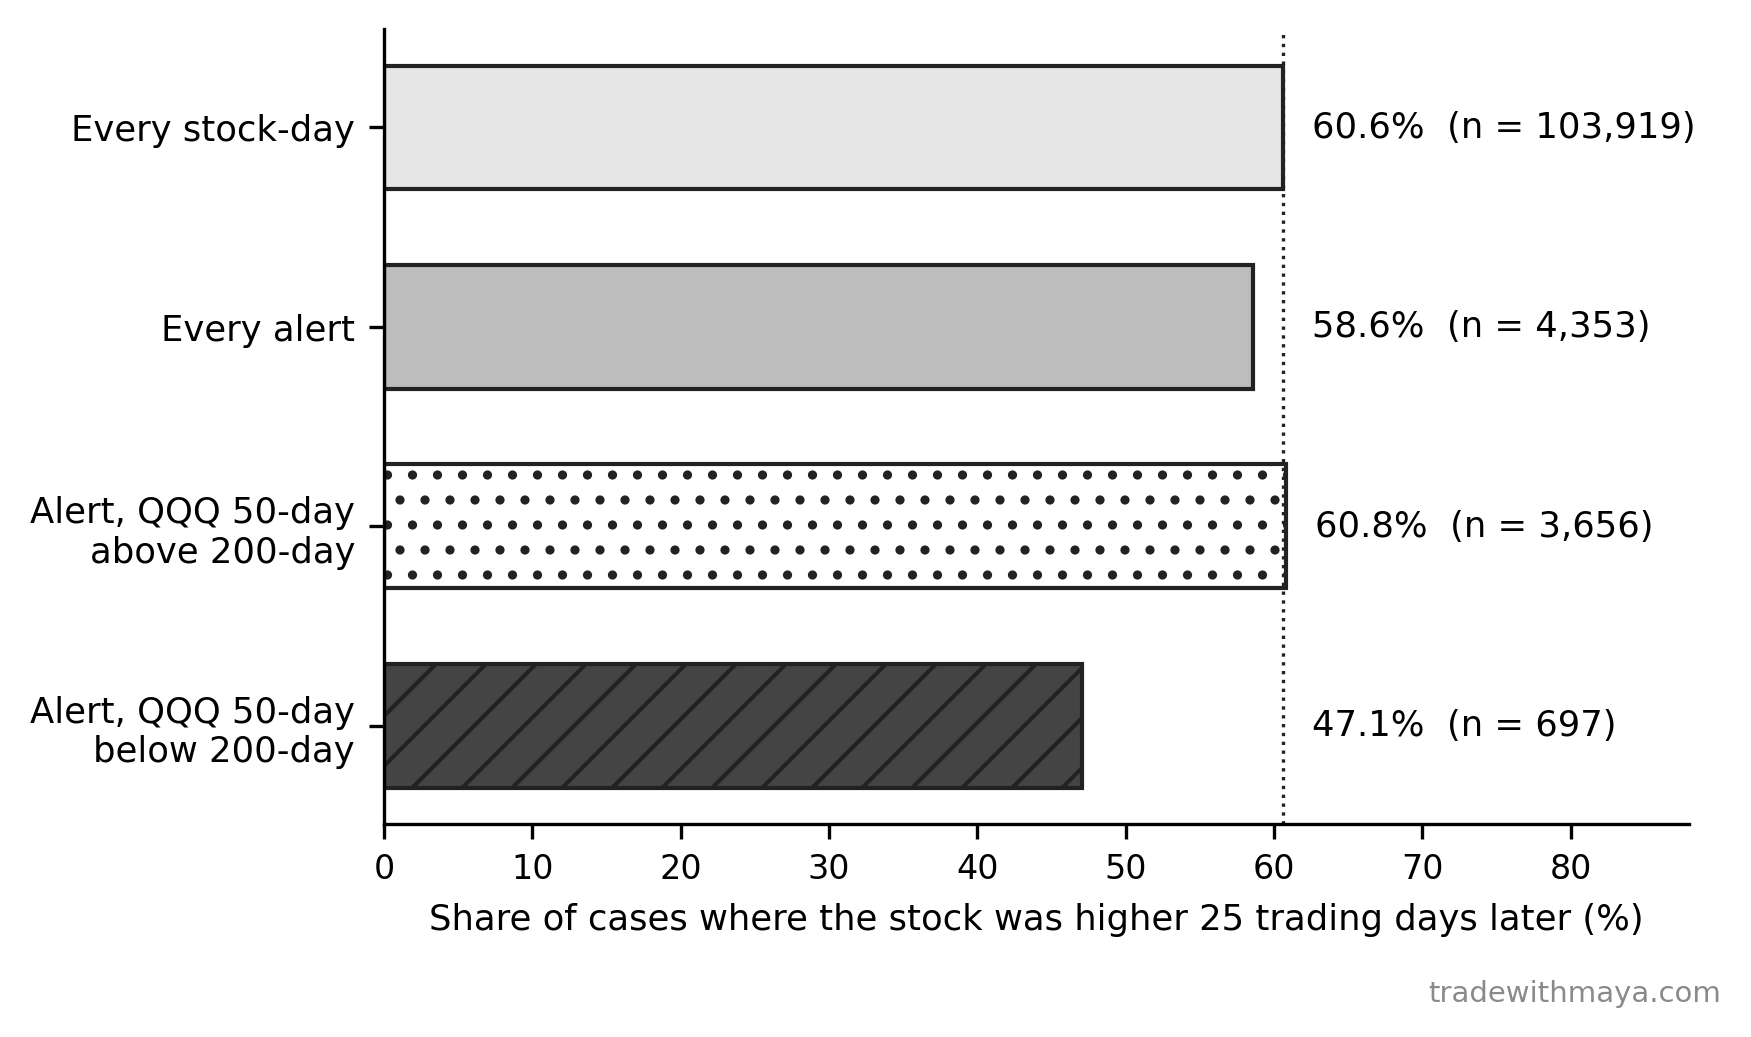
How often the stock was higher 25 trading days after a MACD crossover alert, 2019 through 2024.
How often the stock was higher 25 trading days after a MACD crossover alert, 2019 through 2024. Download full size
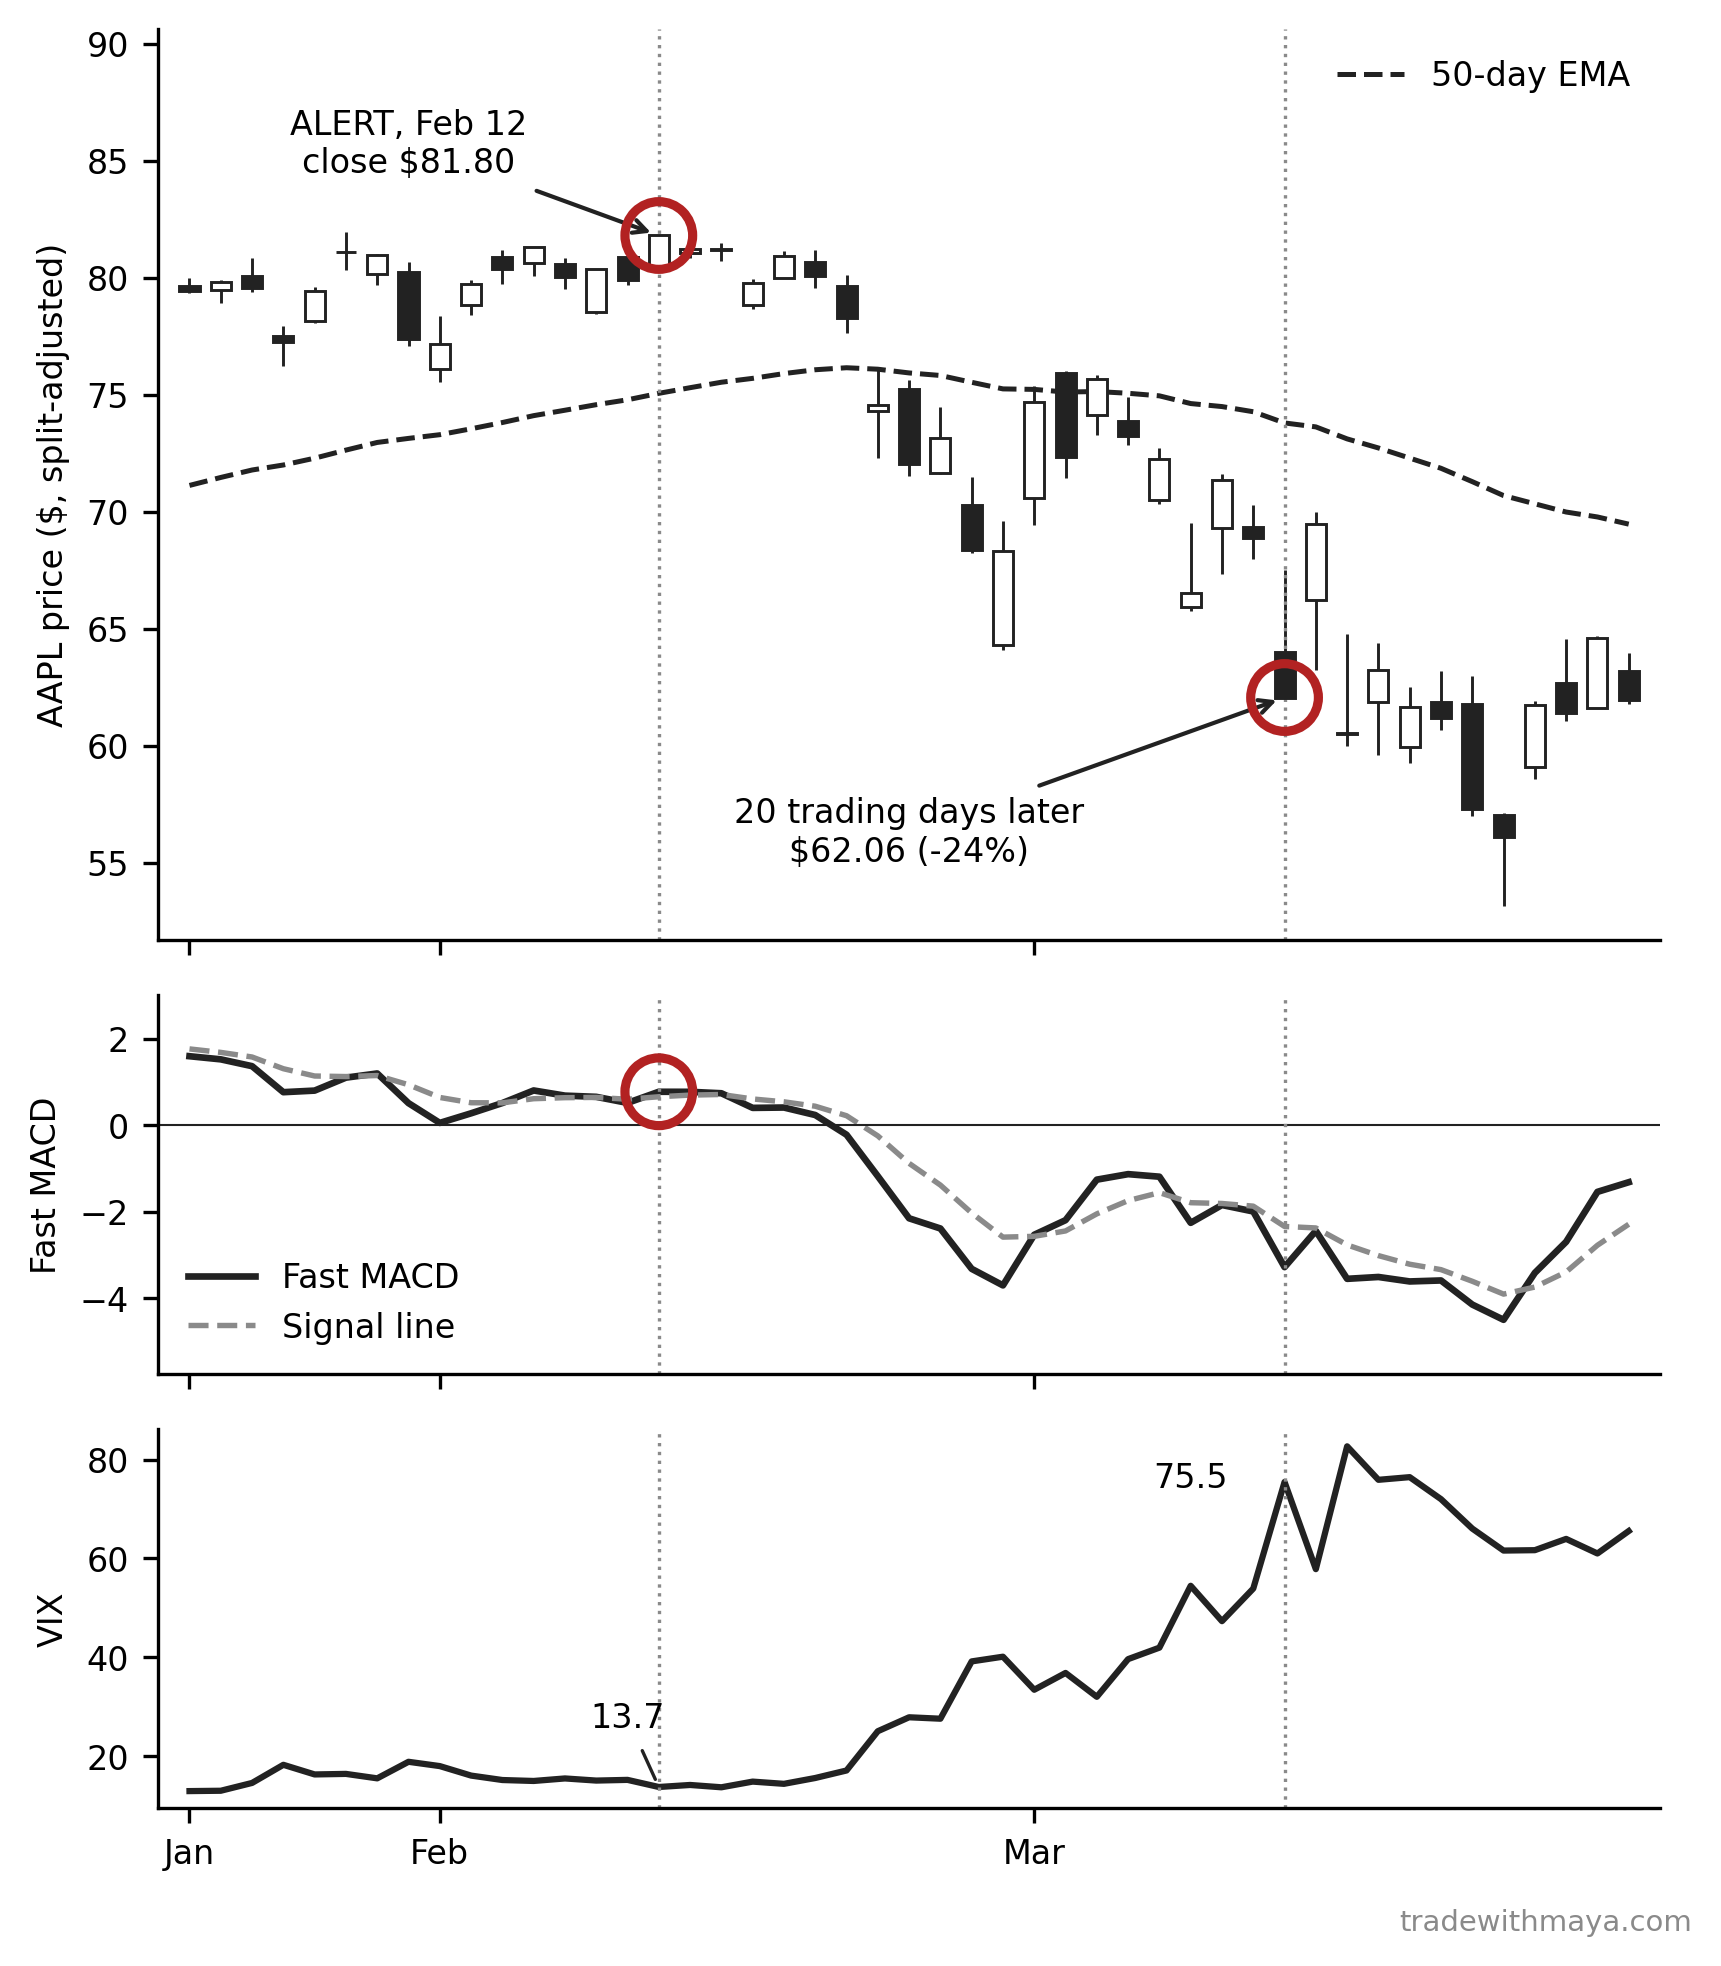
Apple from January to March 2020, using split-adjusted prices.
Apple from January to March 2020, using split-adjusted prices. Download full size
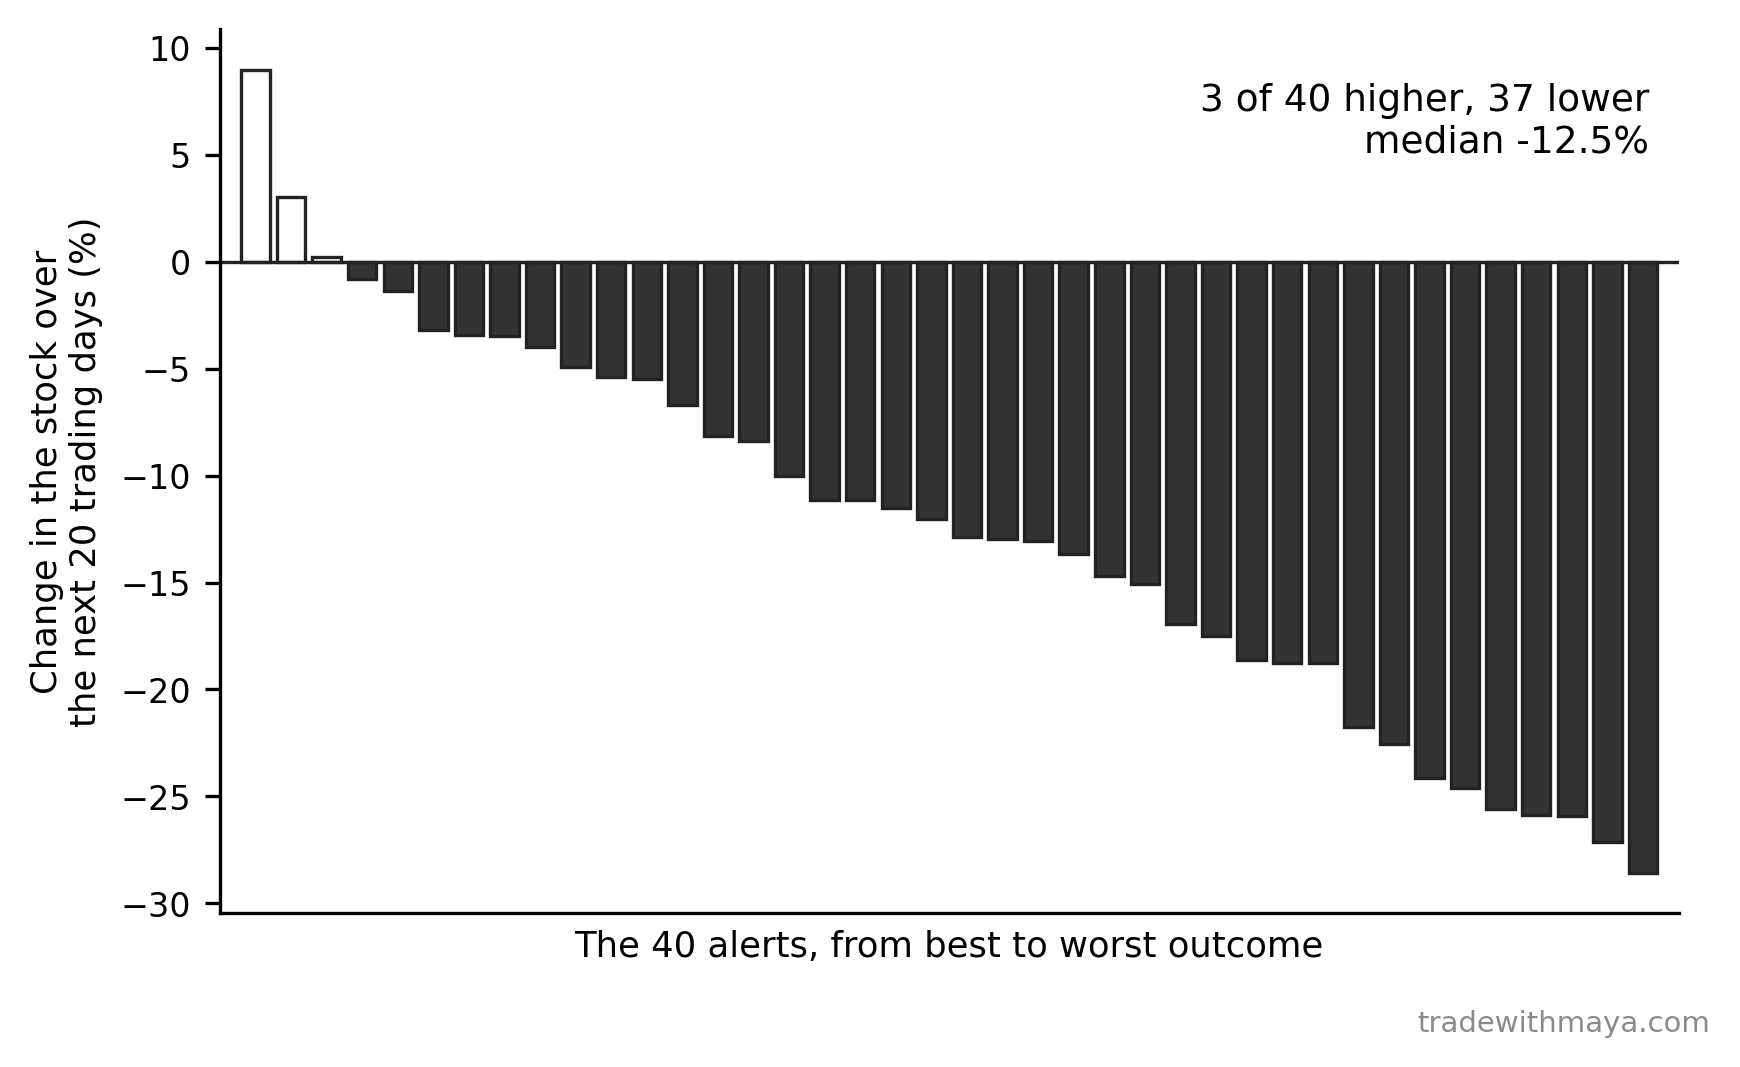
The 40 MACD crossover alerts of February 3 through 14, 2020, sorted from best to worst.
The 40 MACD crossover alerts of February 3 through 14, 2020, sorted from best to worst. Download full size

Chapter 17: You Don't Need to Code to Run ThisBack to top
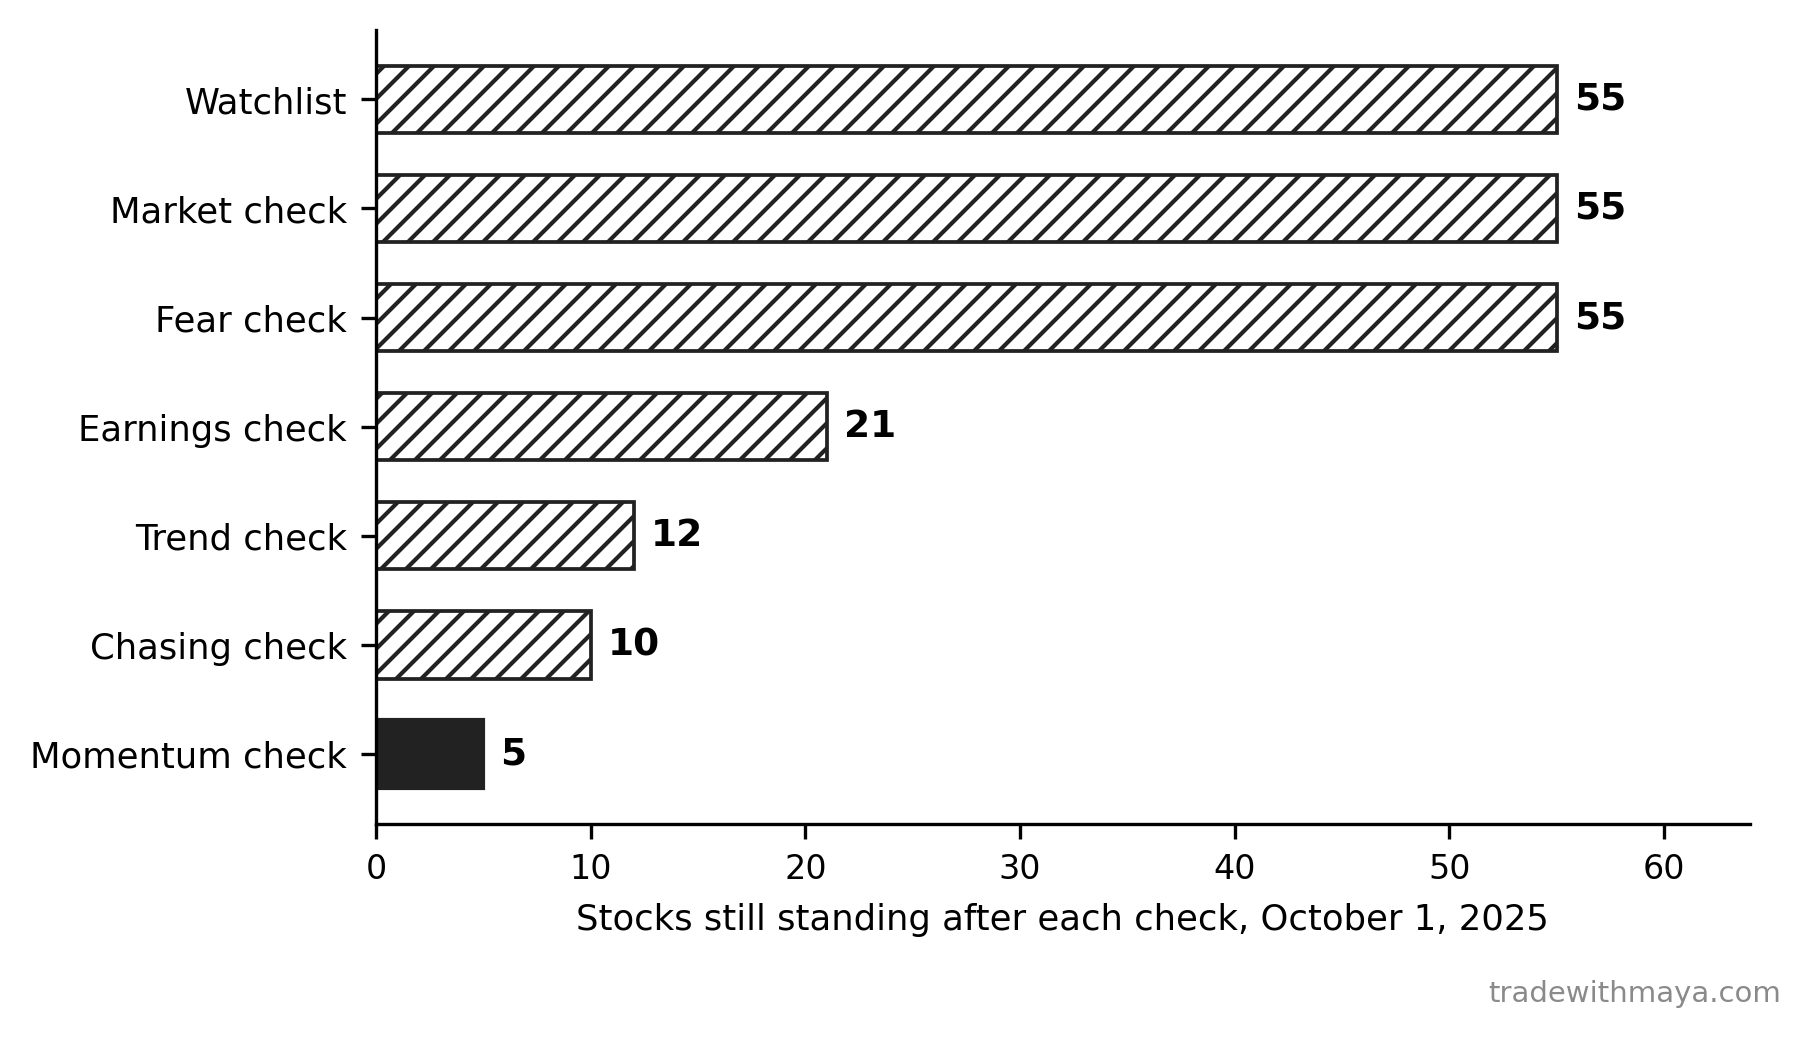
The morning of October 1, 2025.
The morning of October 1, 2025. Download full size
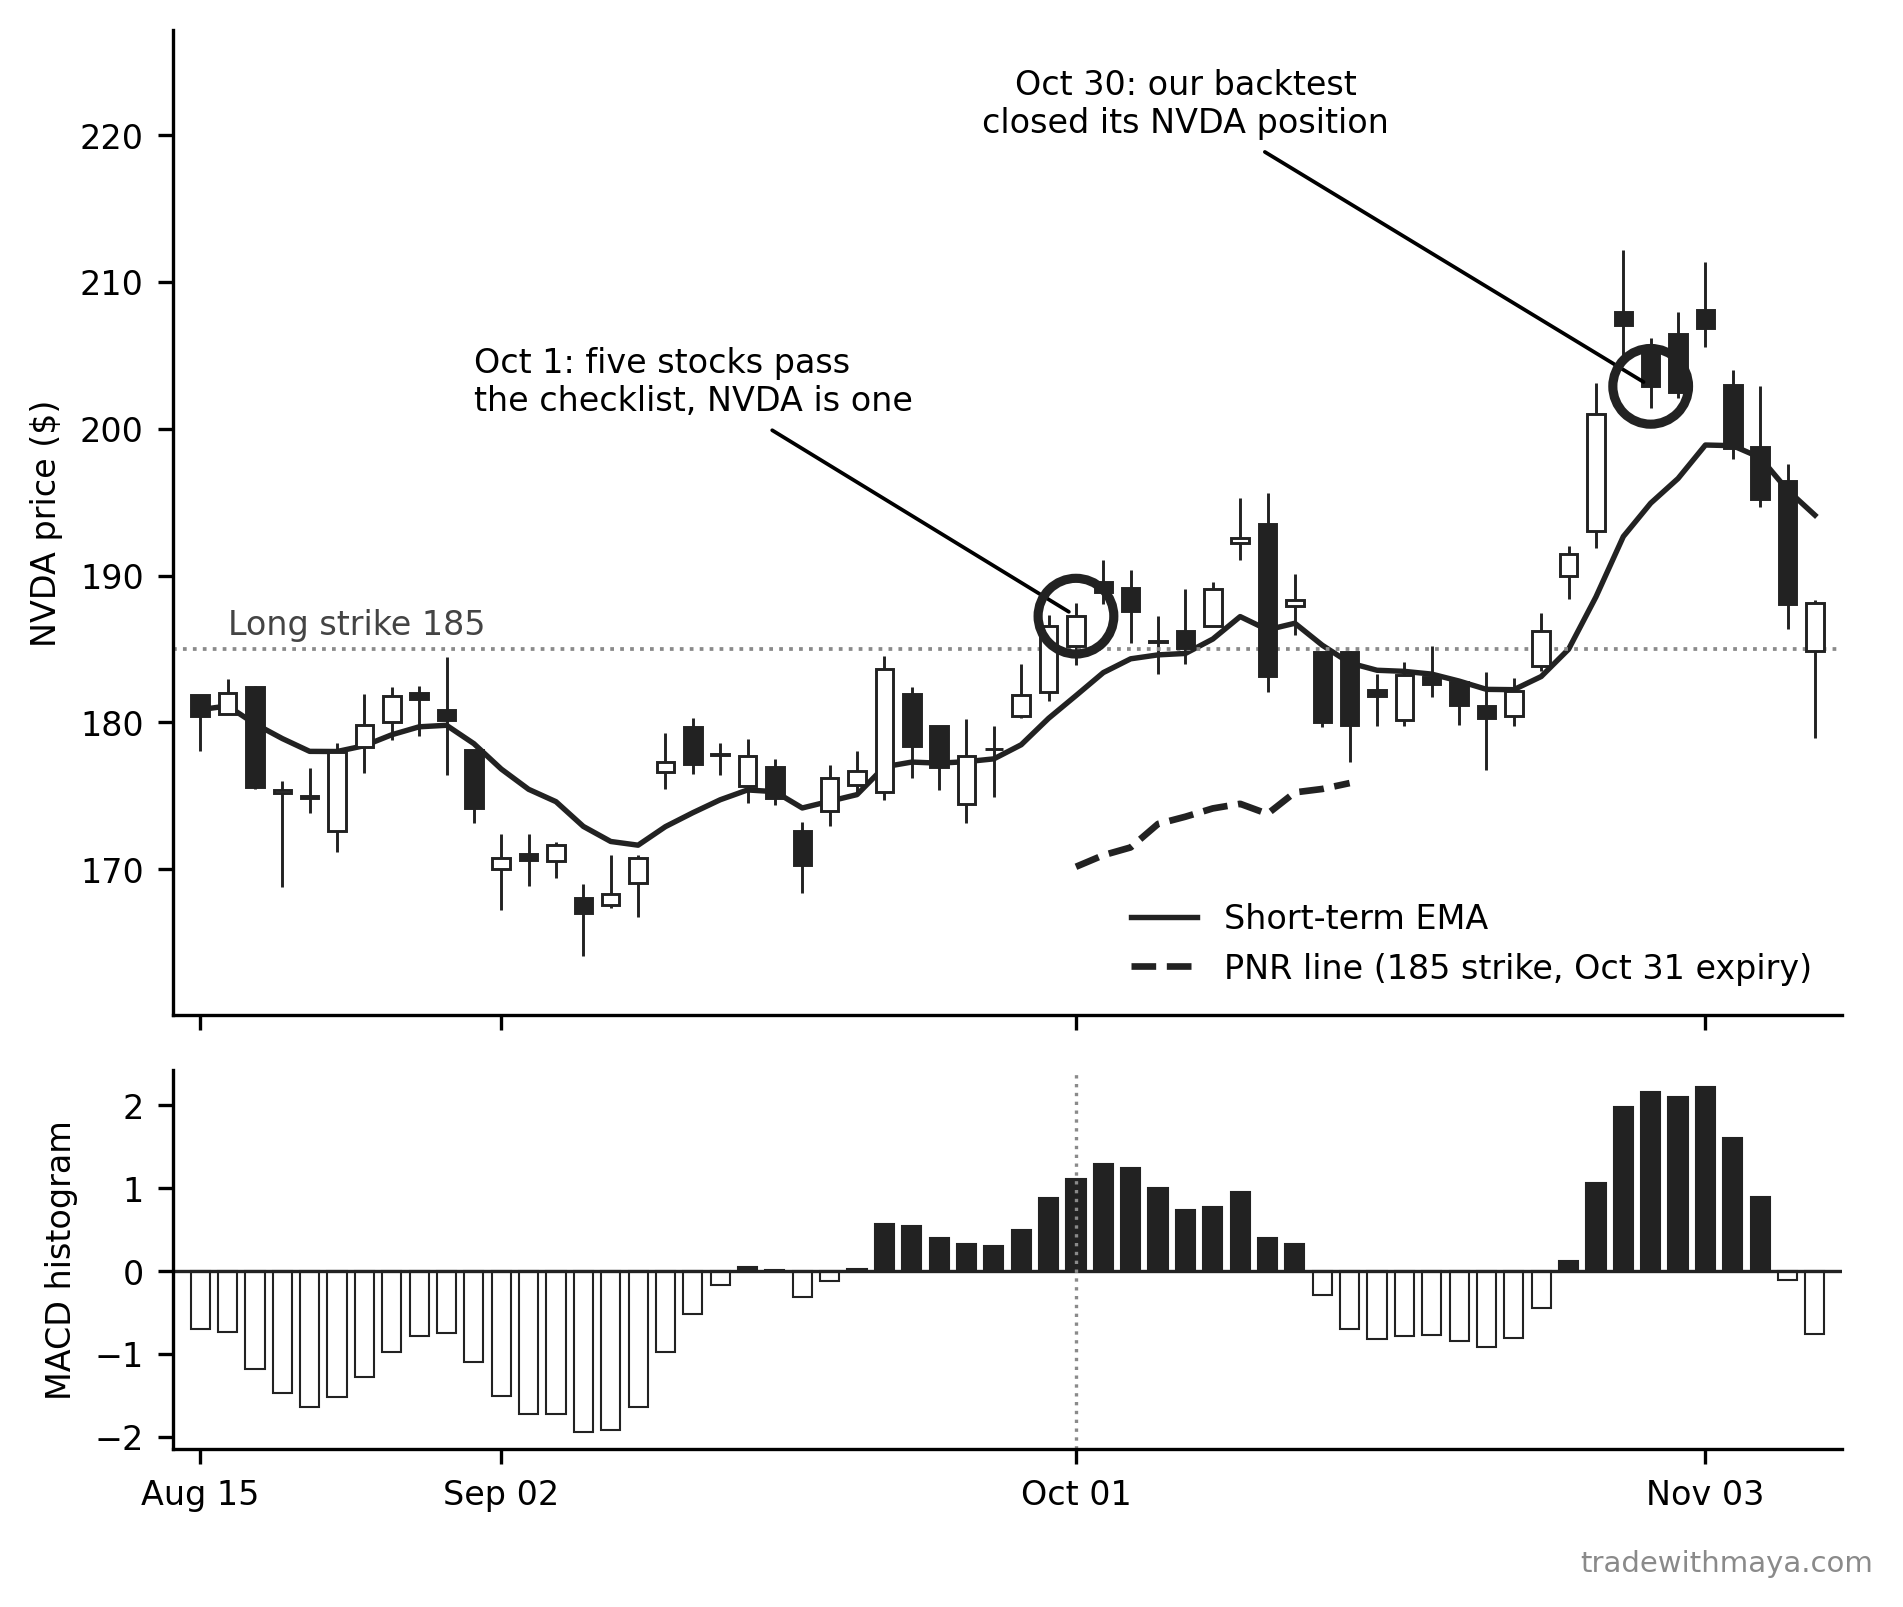
NVDA from mid-August to early November 2025.
NVDA from mid-August to early November 2025. Download full size

Chapter 18: The Real Edge: Consistency Over TimeBack to top
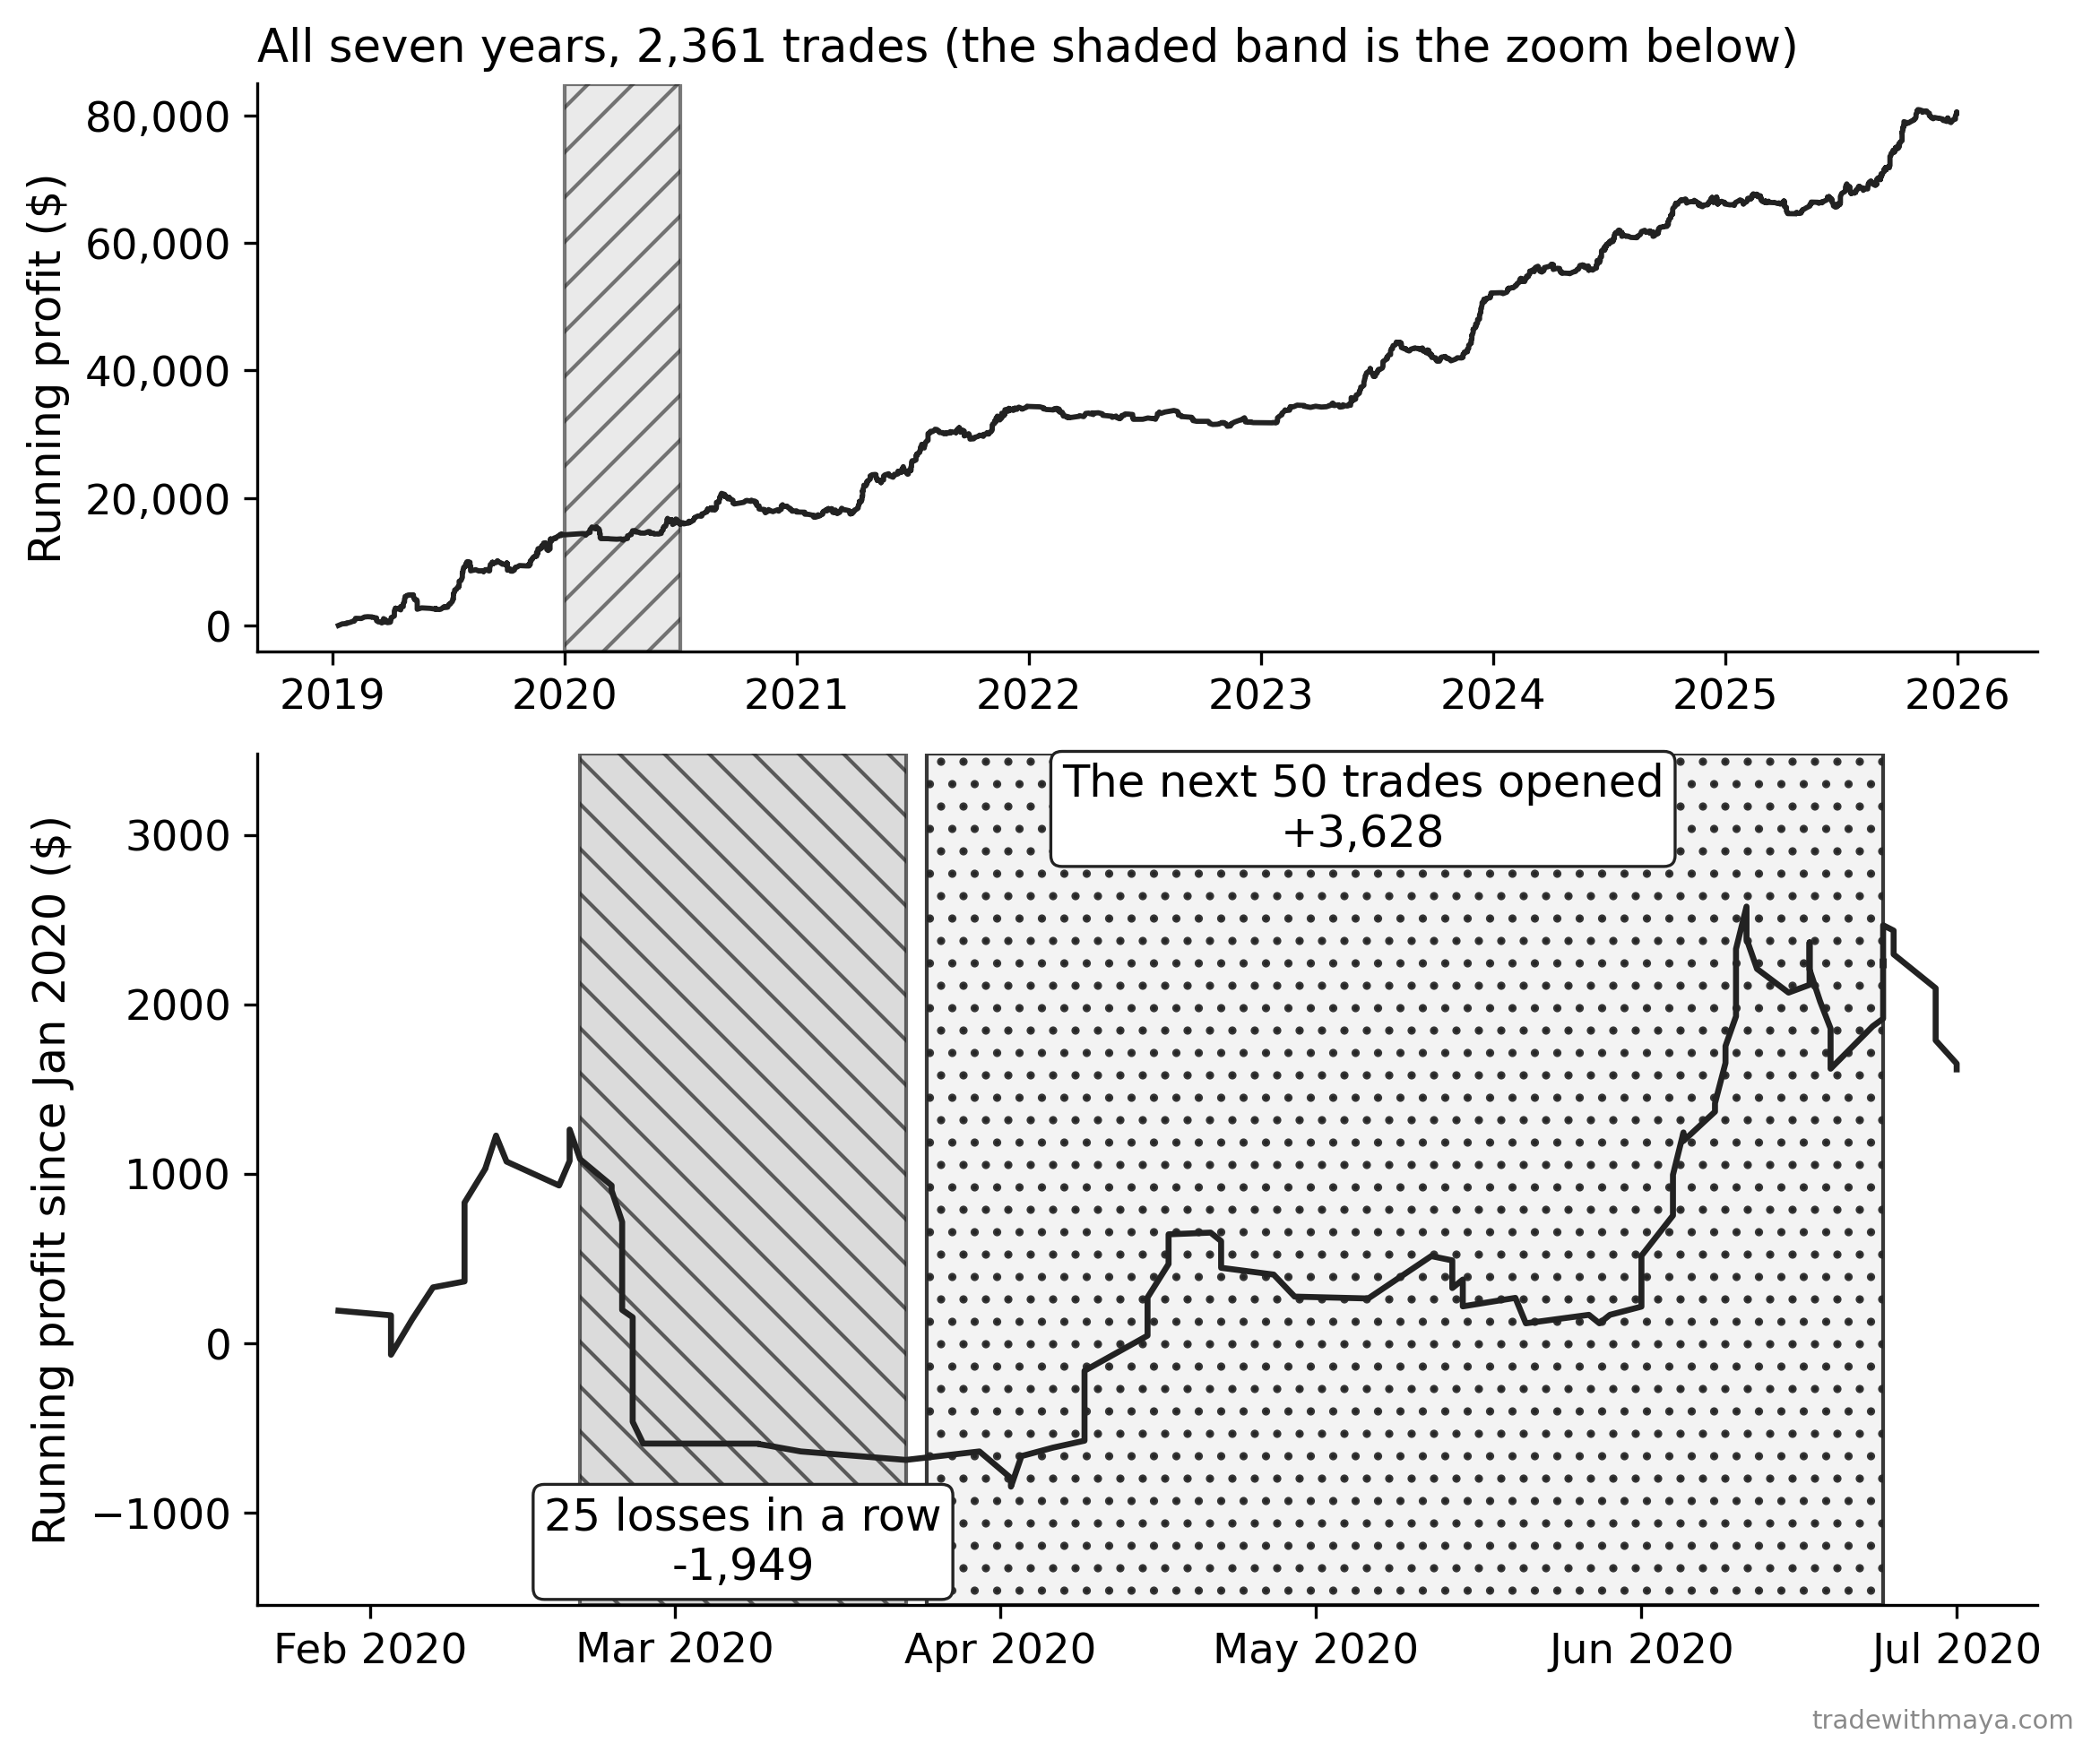
Running profit from the backtest trades, in the order they closed.
Running profit from the backtest trades, in the order they closed. Download full size
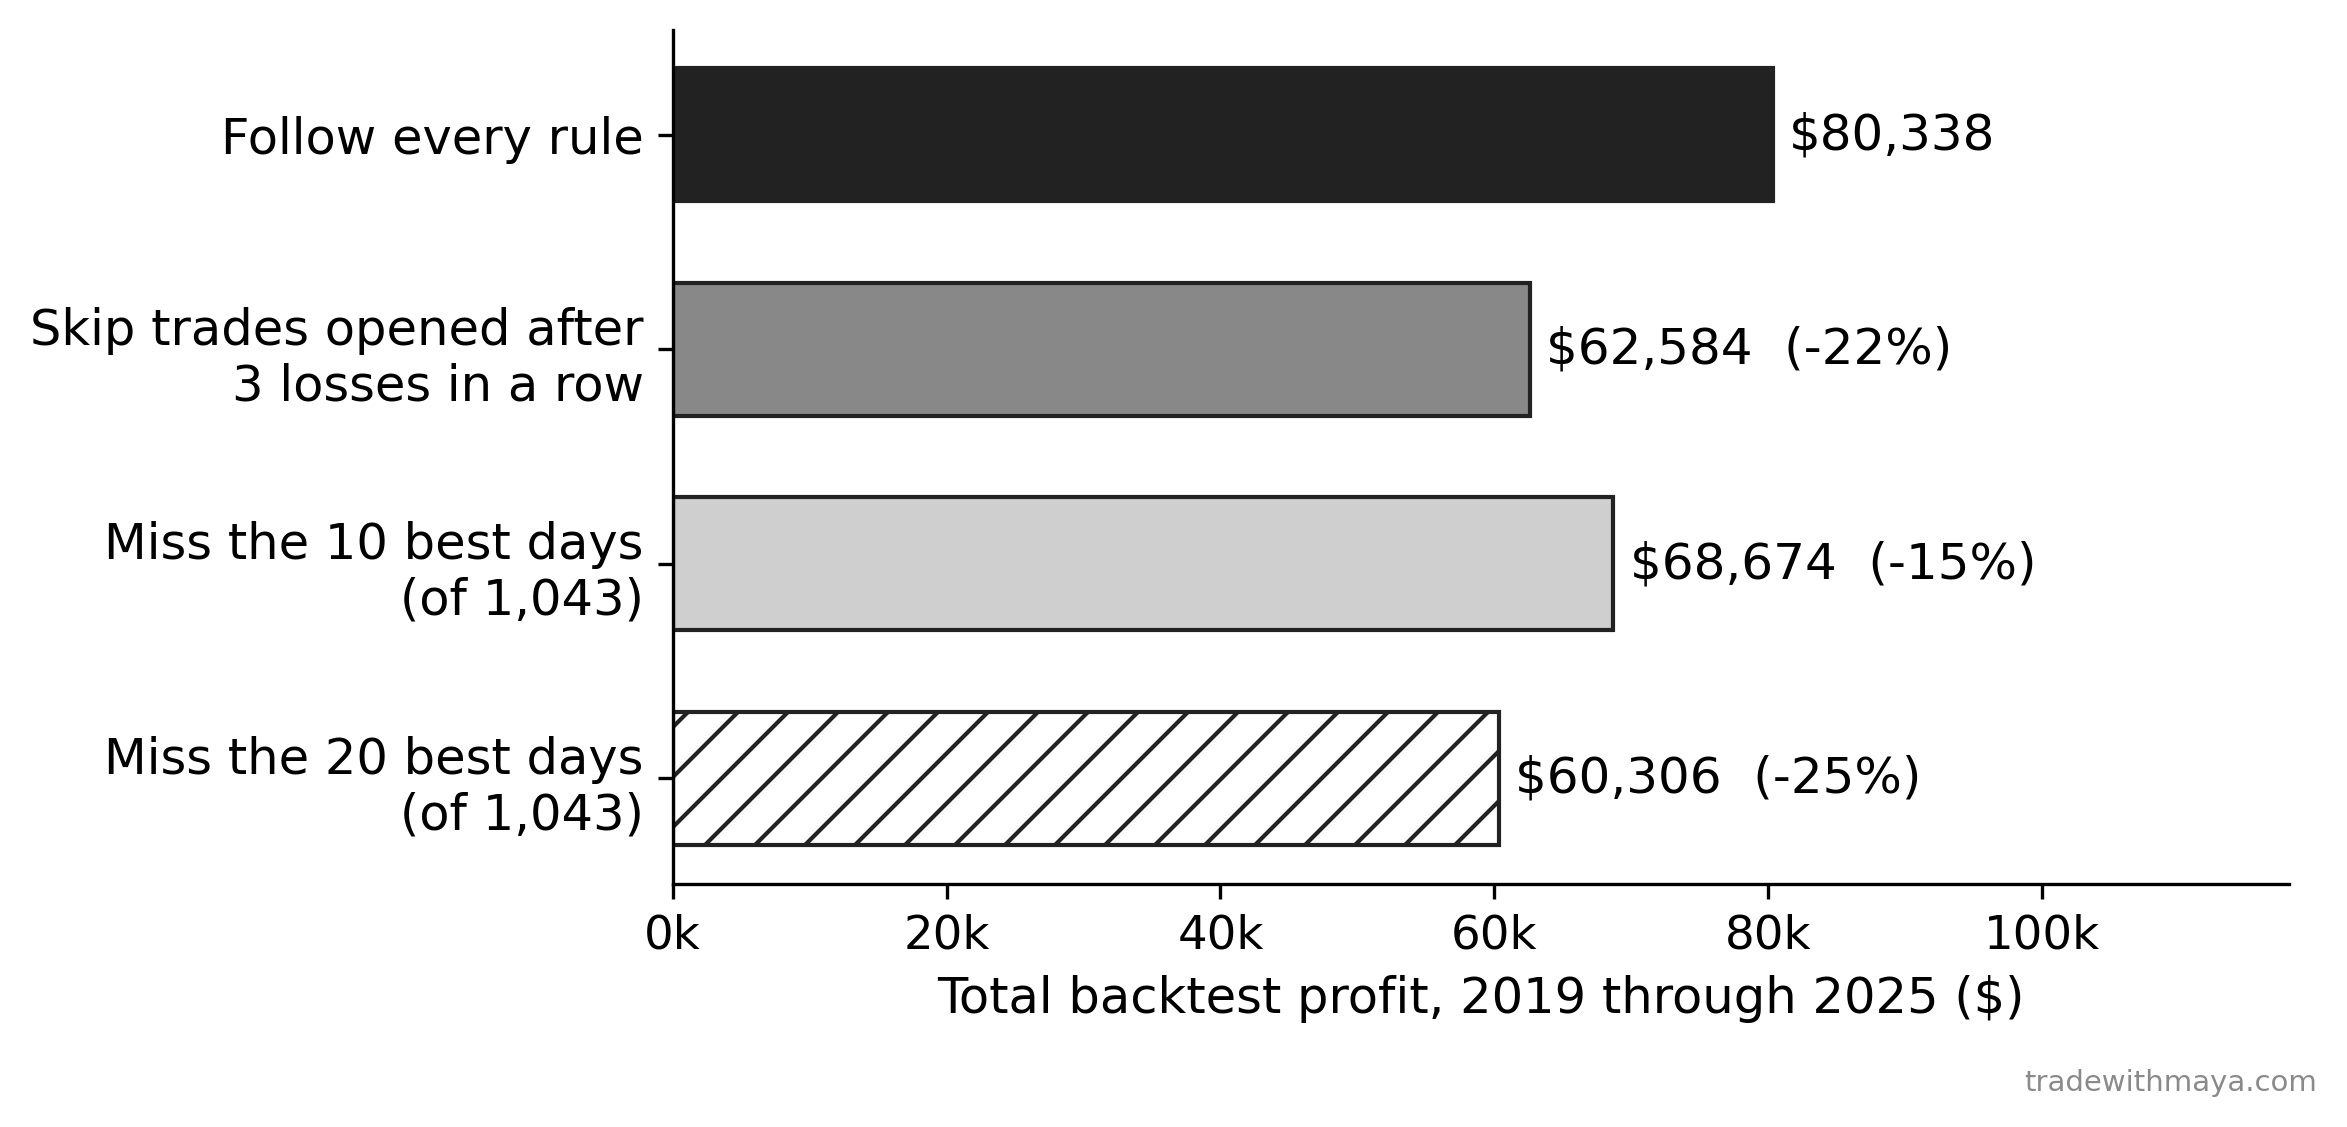
Total backtest profit if every rule is followed, compared with skipping the trades opened after 3 losses in a row, and with missing the best 10 and best 20 days.
Total backtest profit if every rule is followed, compared with skipping the trades opened after 3 losses in a row, and with missing the best 10 and best 20 days. Download full size
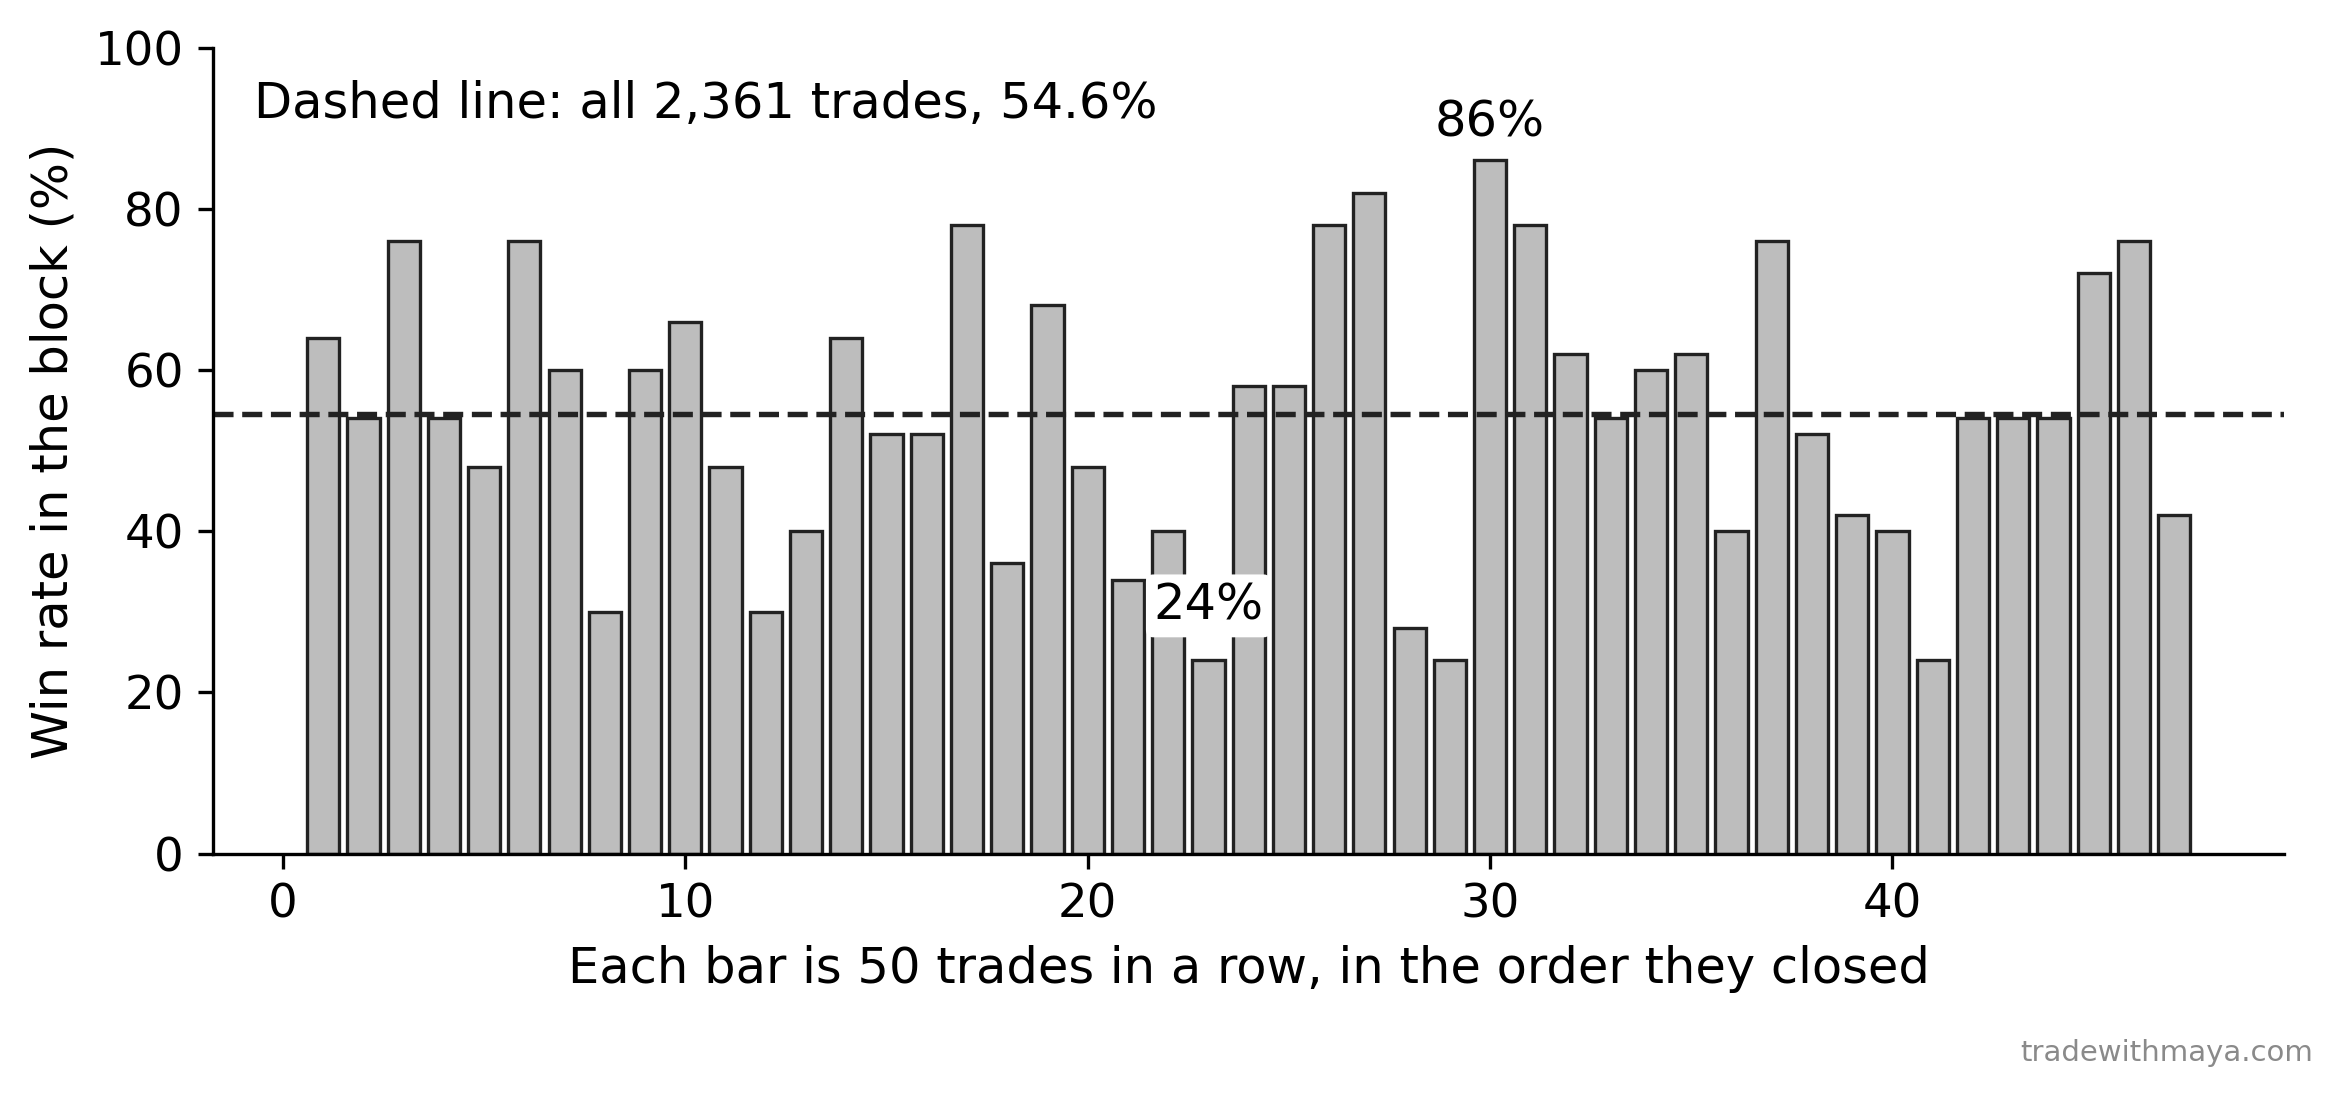
The win rate in each block of 50 trades in a row from the backtest.
The win rate in each block of 50 trades in a row from the backtest. Download full size

Chapter 19: After the Crash, the Harder TradeBack to top
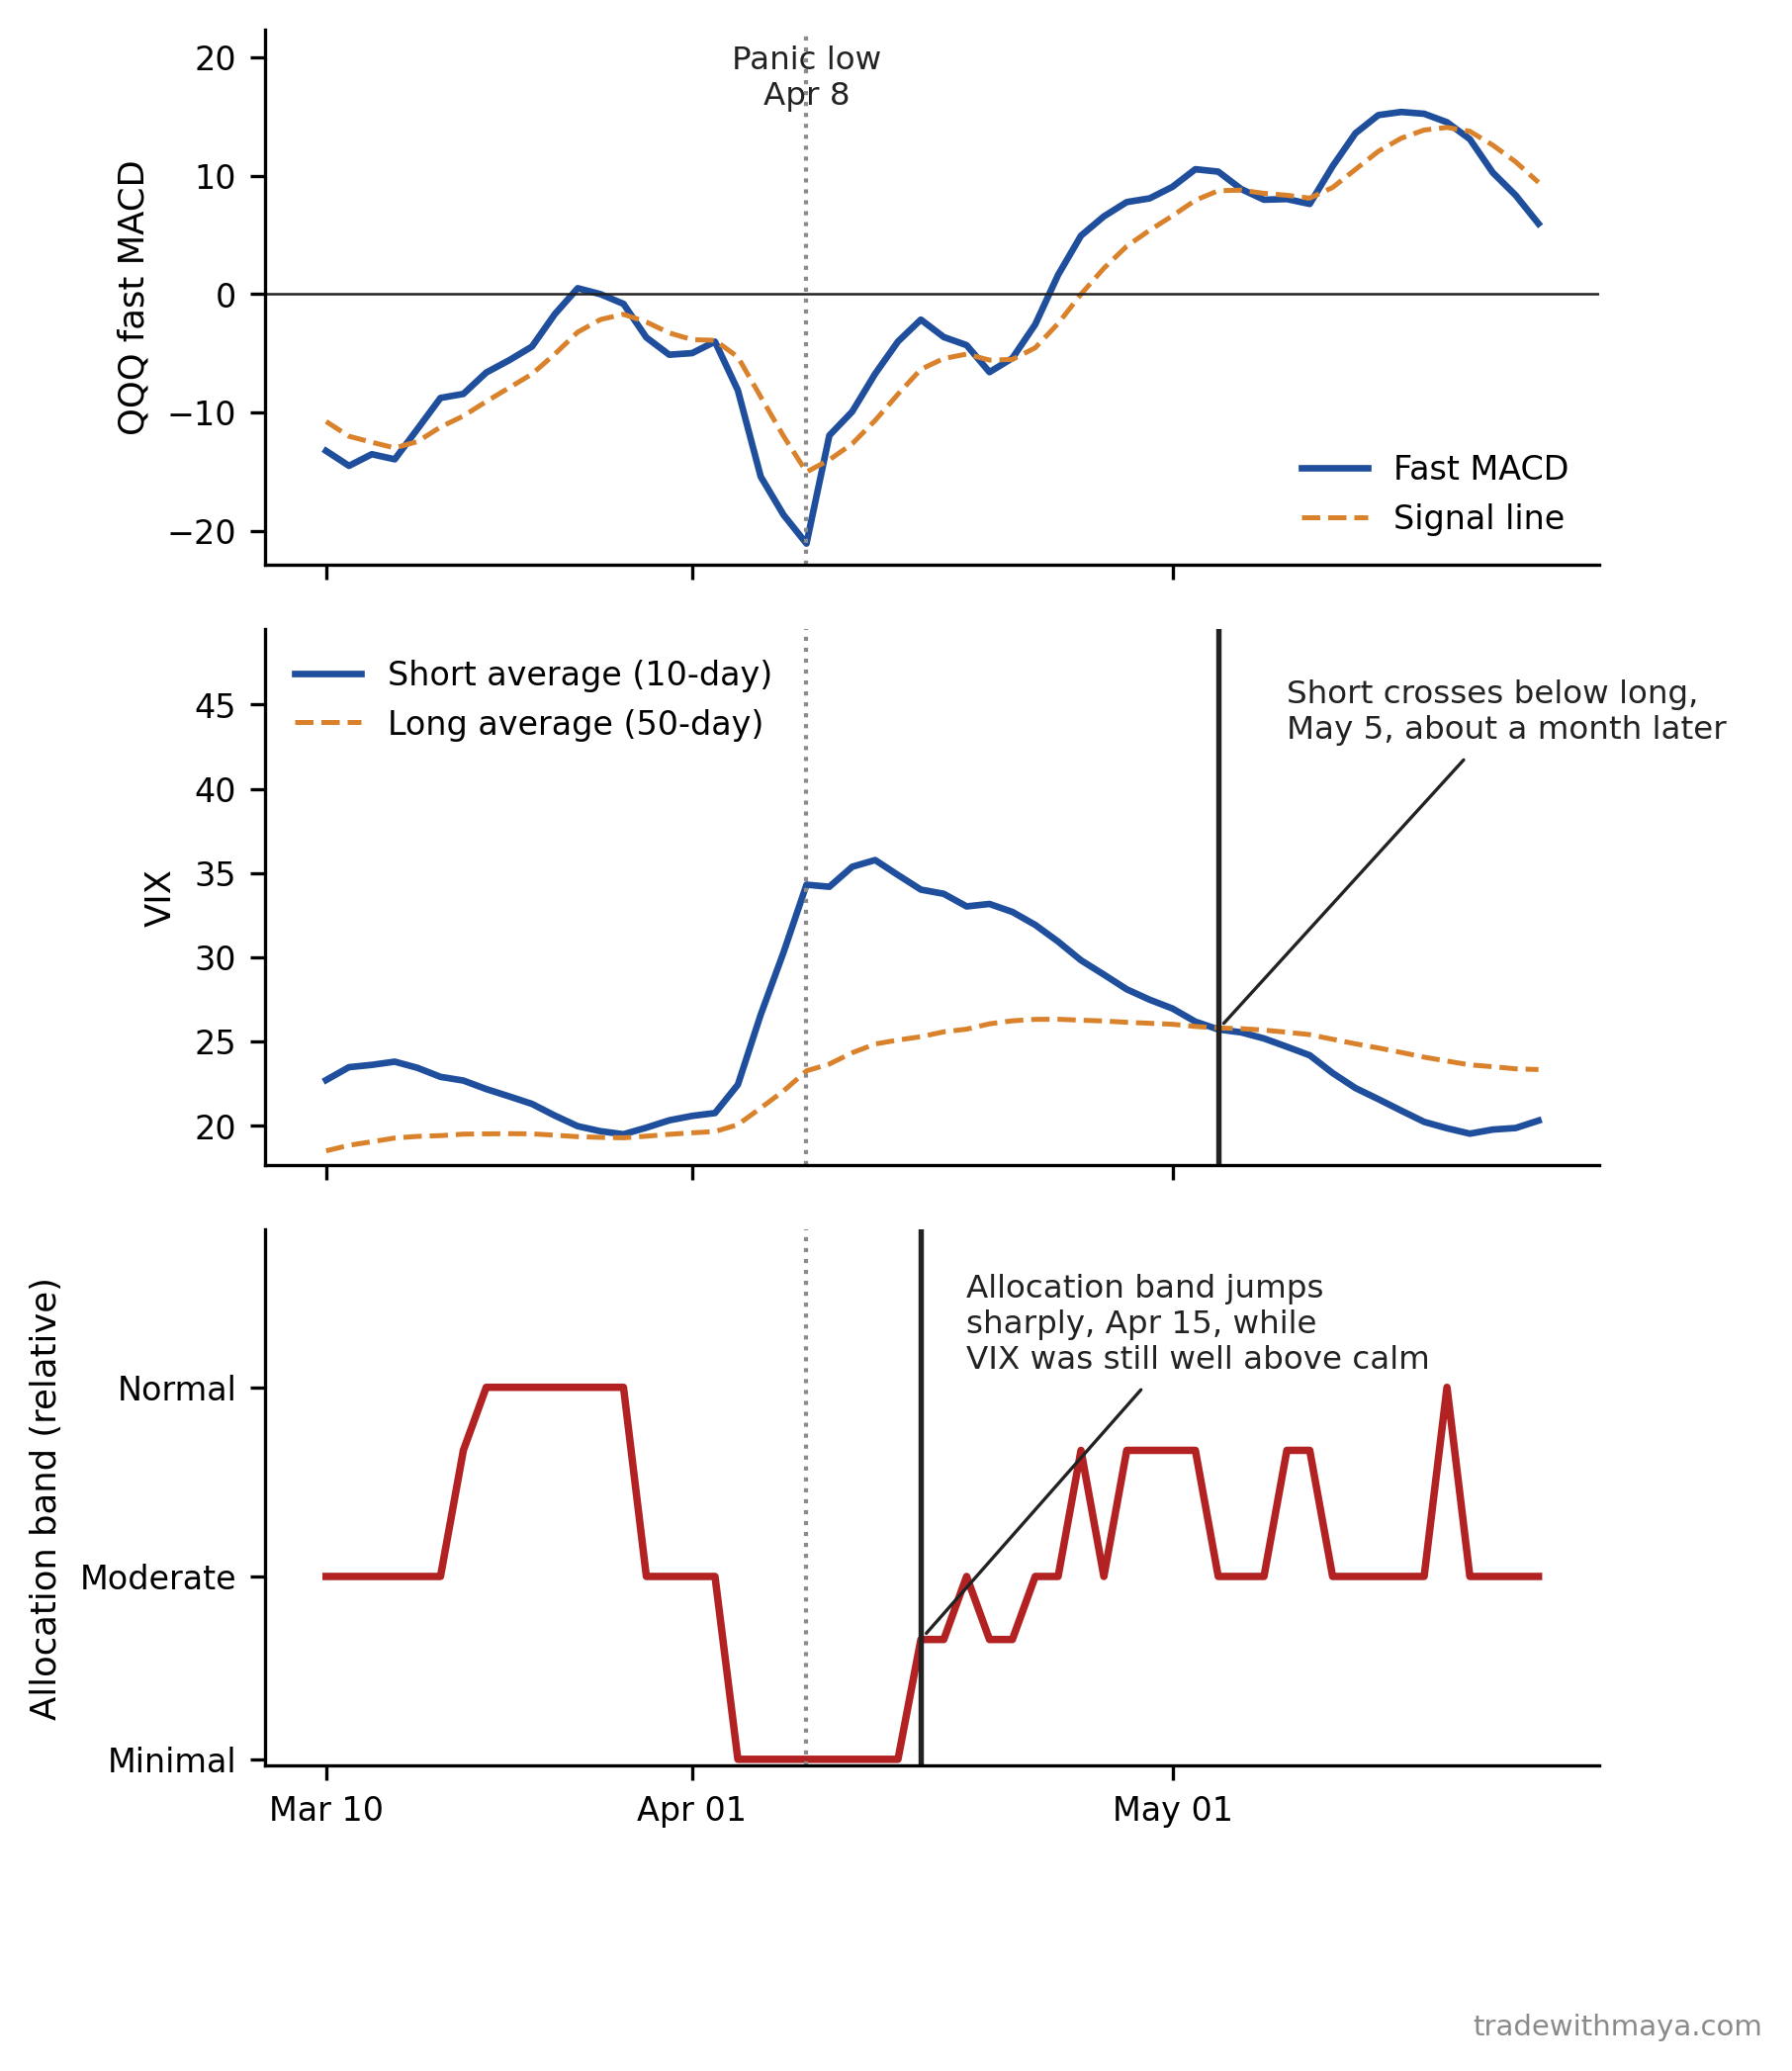
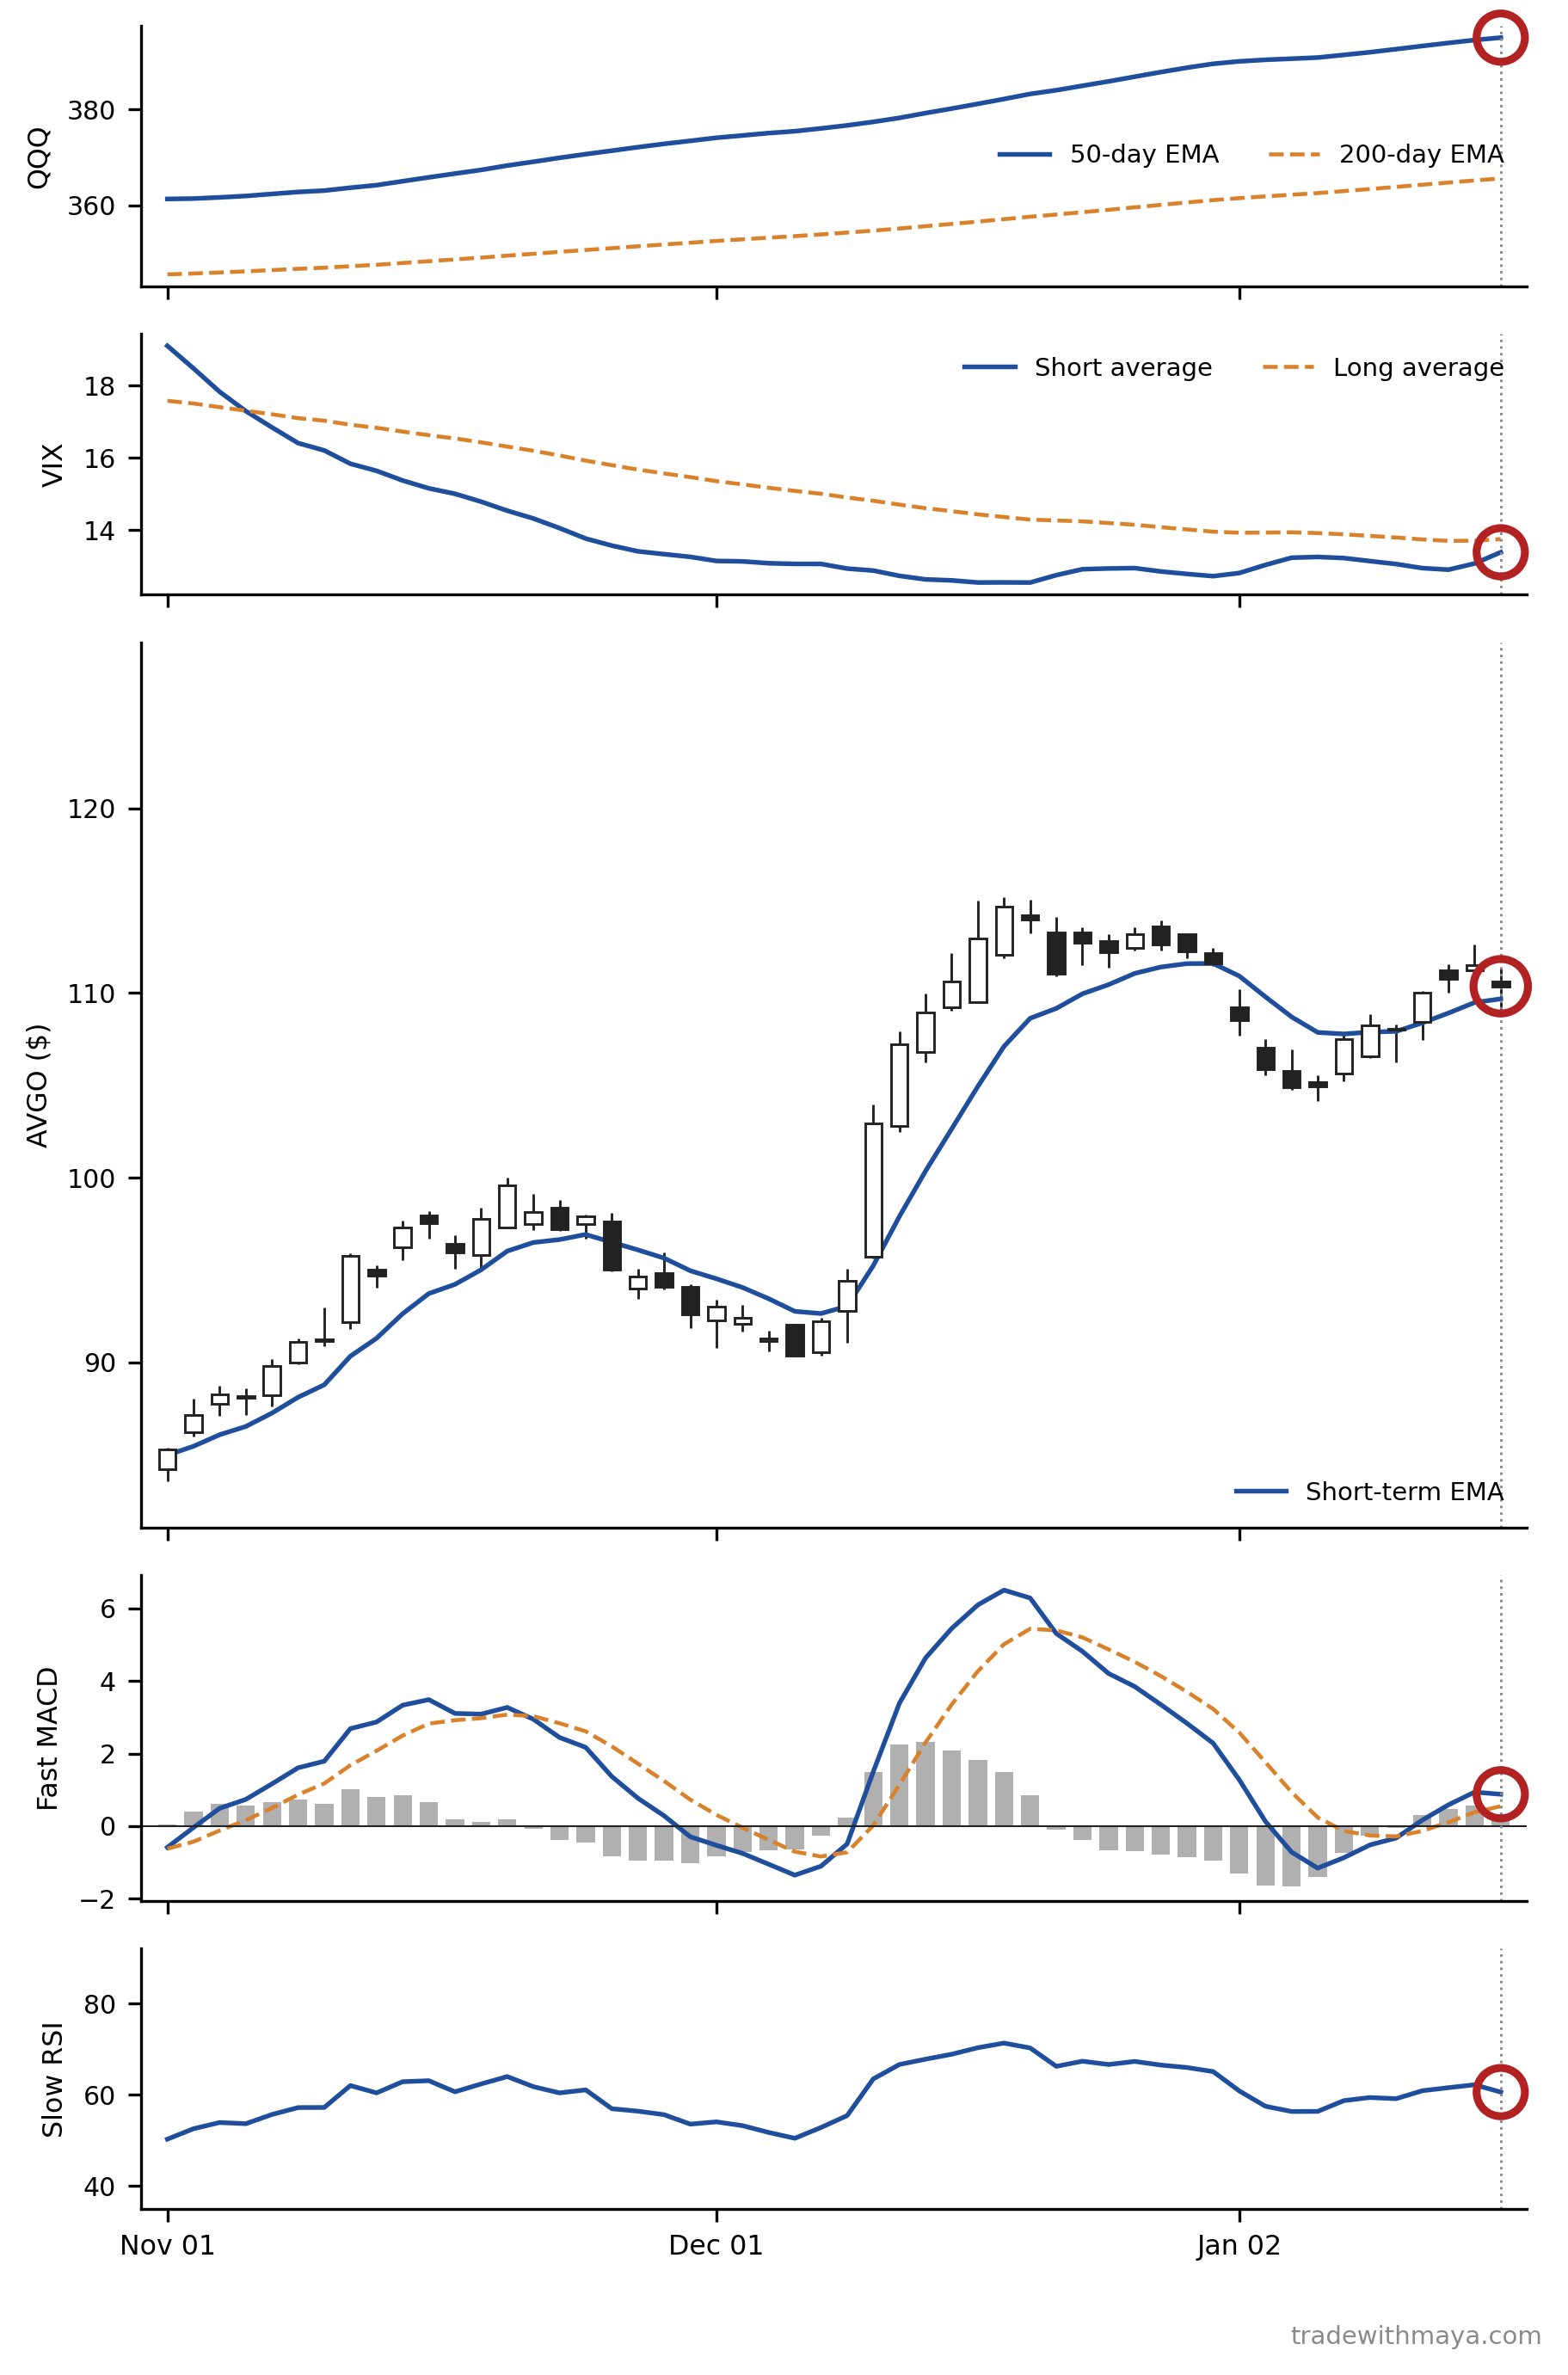
QQQ's fast MACD, VIX's fear gauge, and the system's own capital-allocation band through the April-May 2025 tariff-crash recovery.
QQQ's fast MACD, VIX's fear gauge, and the system's own capital-allocation band through the April-May 2025 tariff-crash recovery. Download full size

Chapter 20: What the Return Number Doesn't Tell YouBack to top
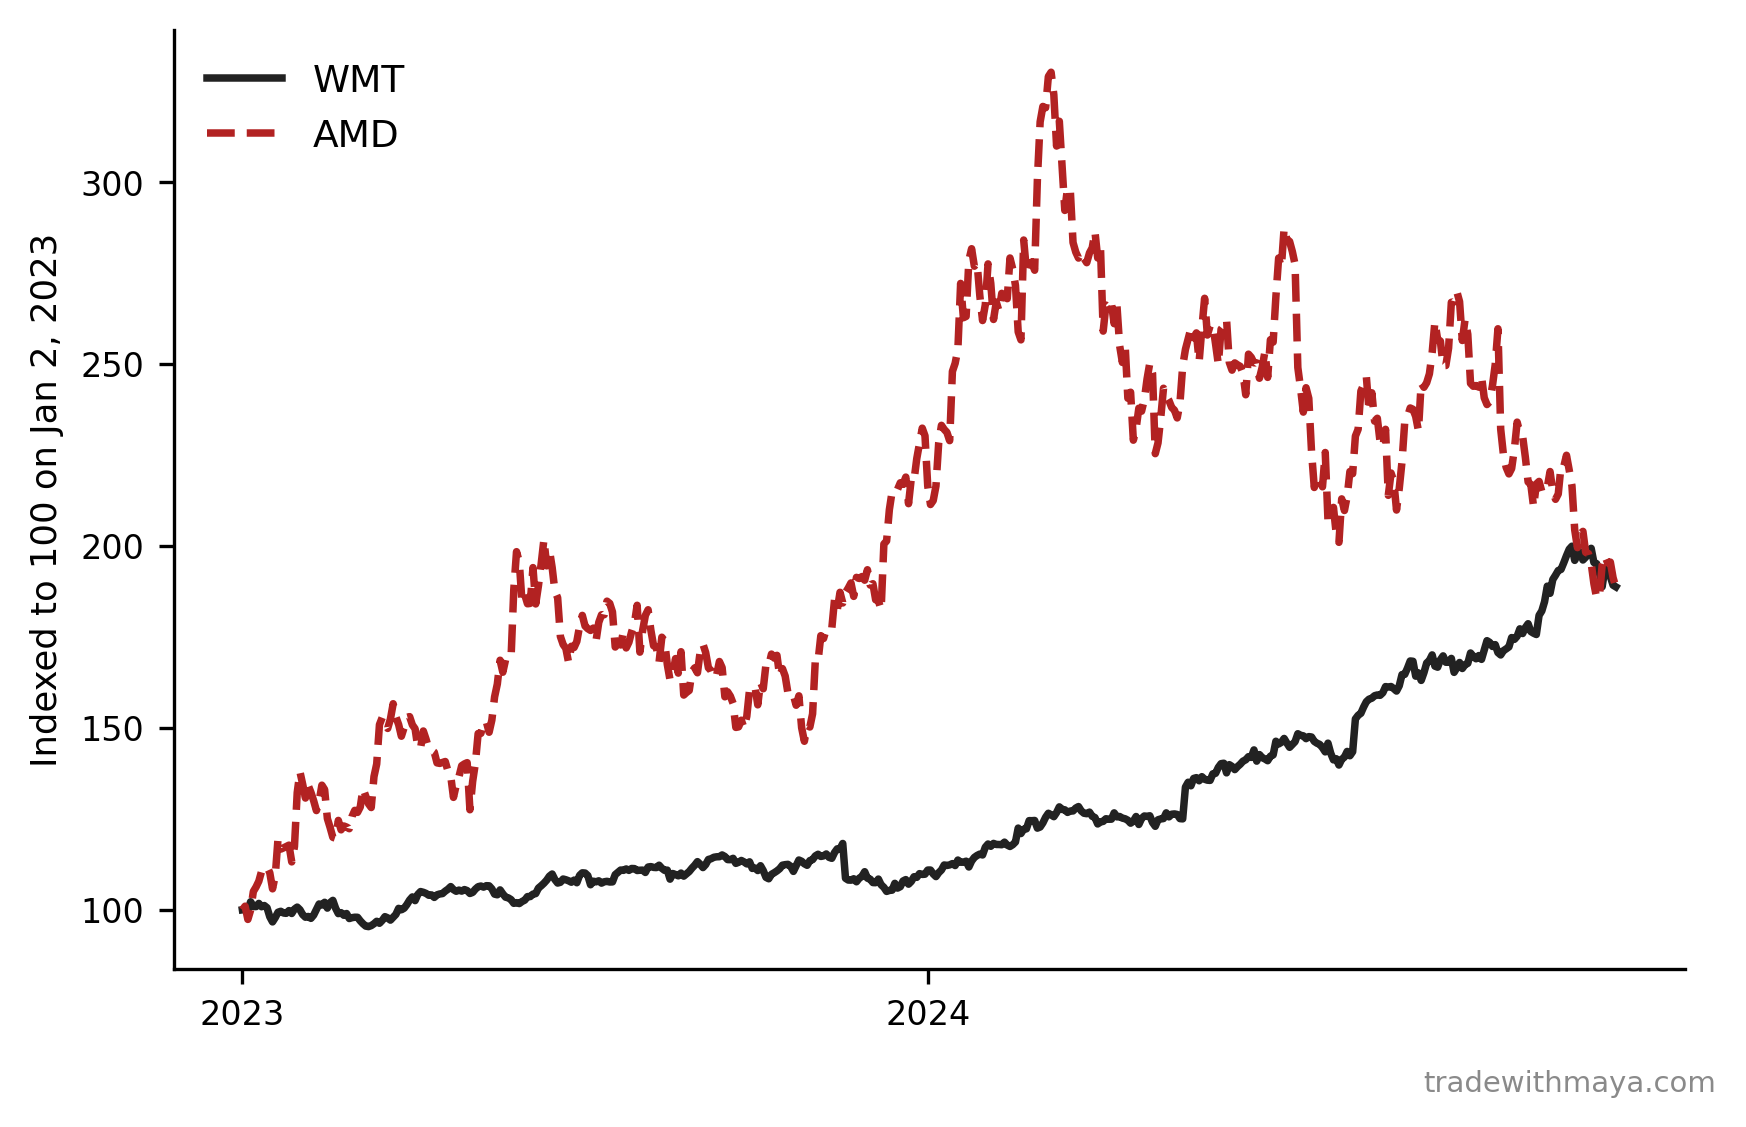
Walmart and AMD, both roughly +89% over 2023 and 2024, rebased to the same starting point.
Walmart and AMD, both roughly +89% over 2023 and 2024, rebased to the same starting point. Download full size

Chapter 21: Ten Thousand Alternate TimelinesBack to top
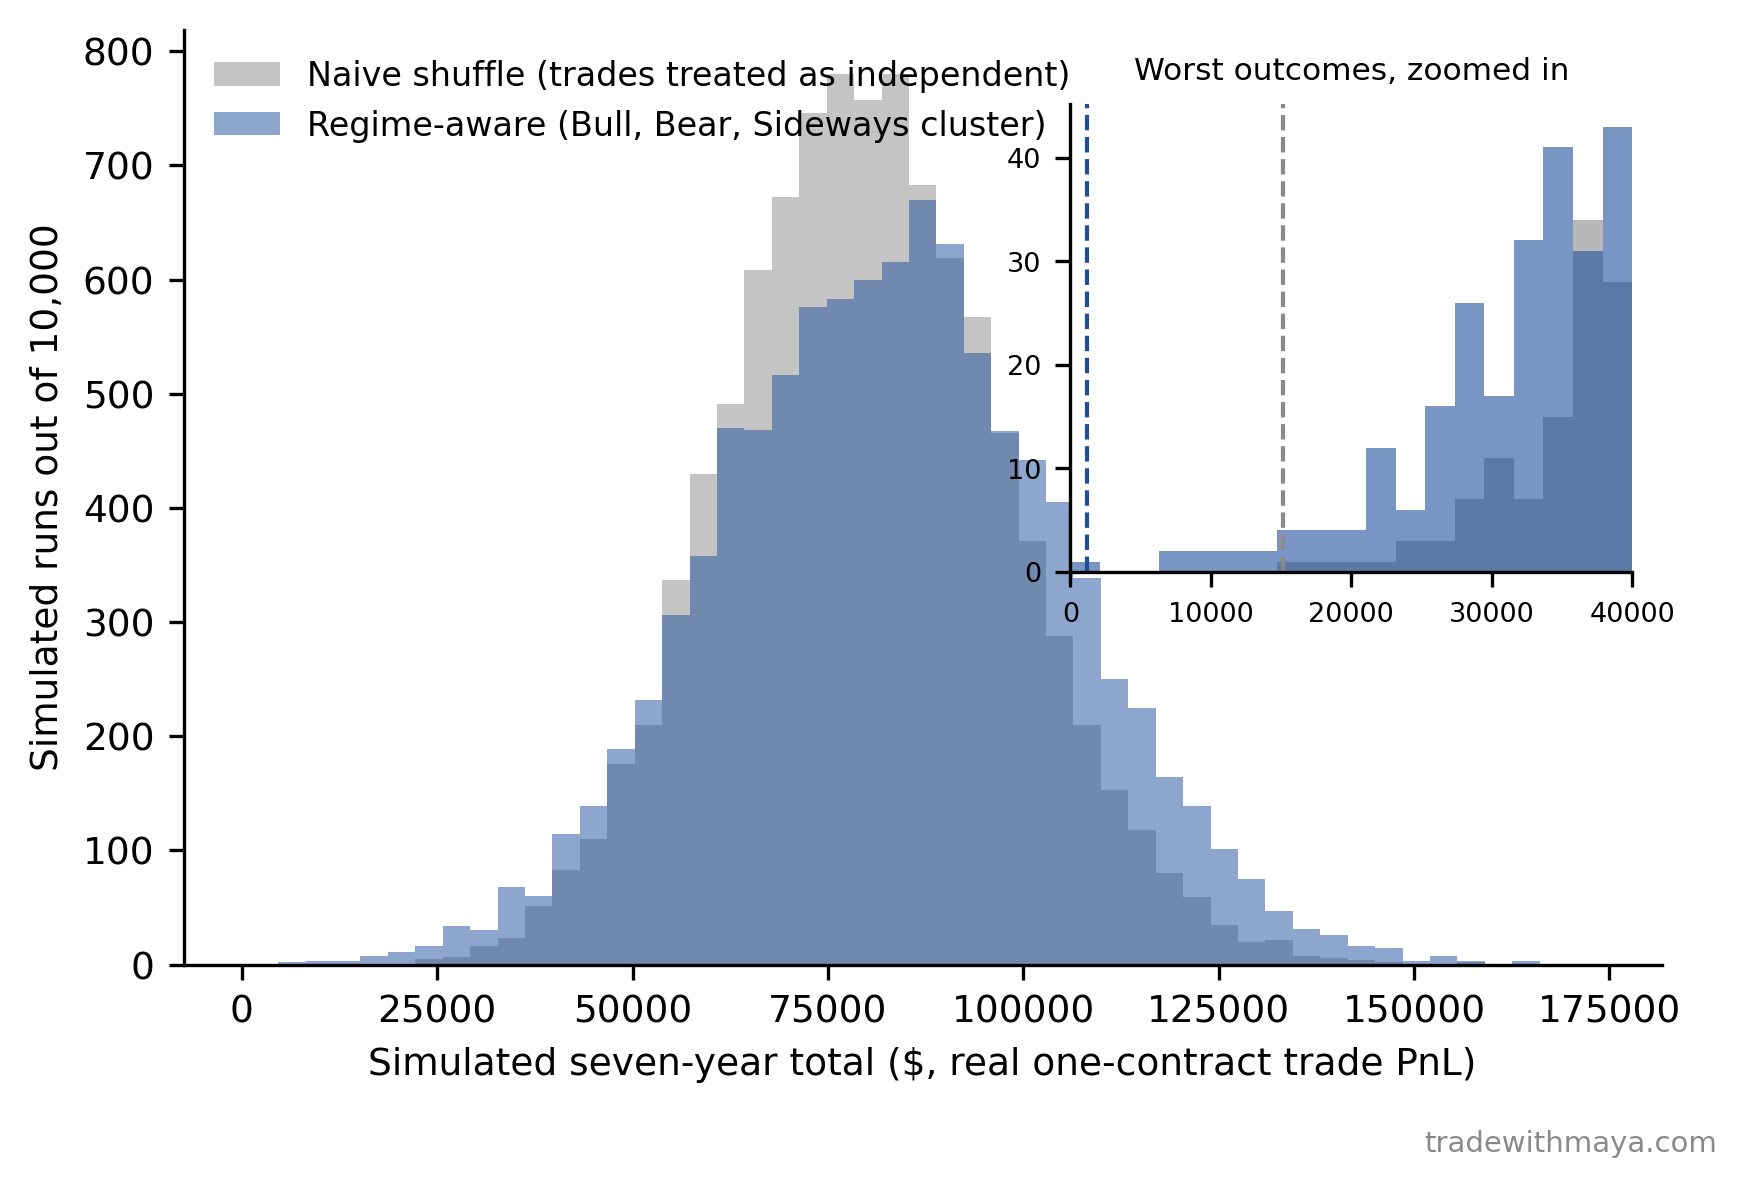
10,000 simulated seven-year totals, naive shuffle against a regime-aware version that lets Bull, Bear, and Sideways months cluster the way they do in real history.
10,000 simulated seven-year totals, naive shuffle against a regime-aware version that lets Bull, Bear, and Sideways months cluster the way they do in real history. Download full size

Chapter 22: The WorkbookBack to top
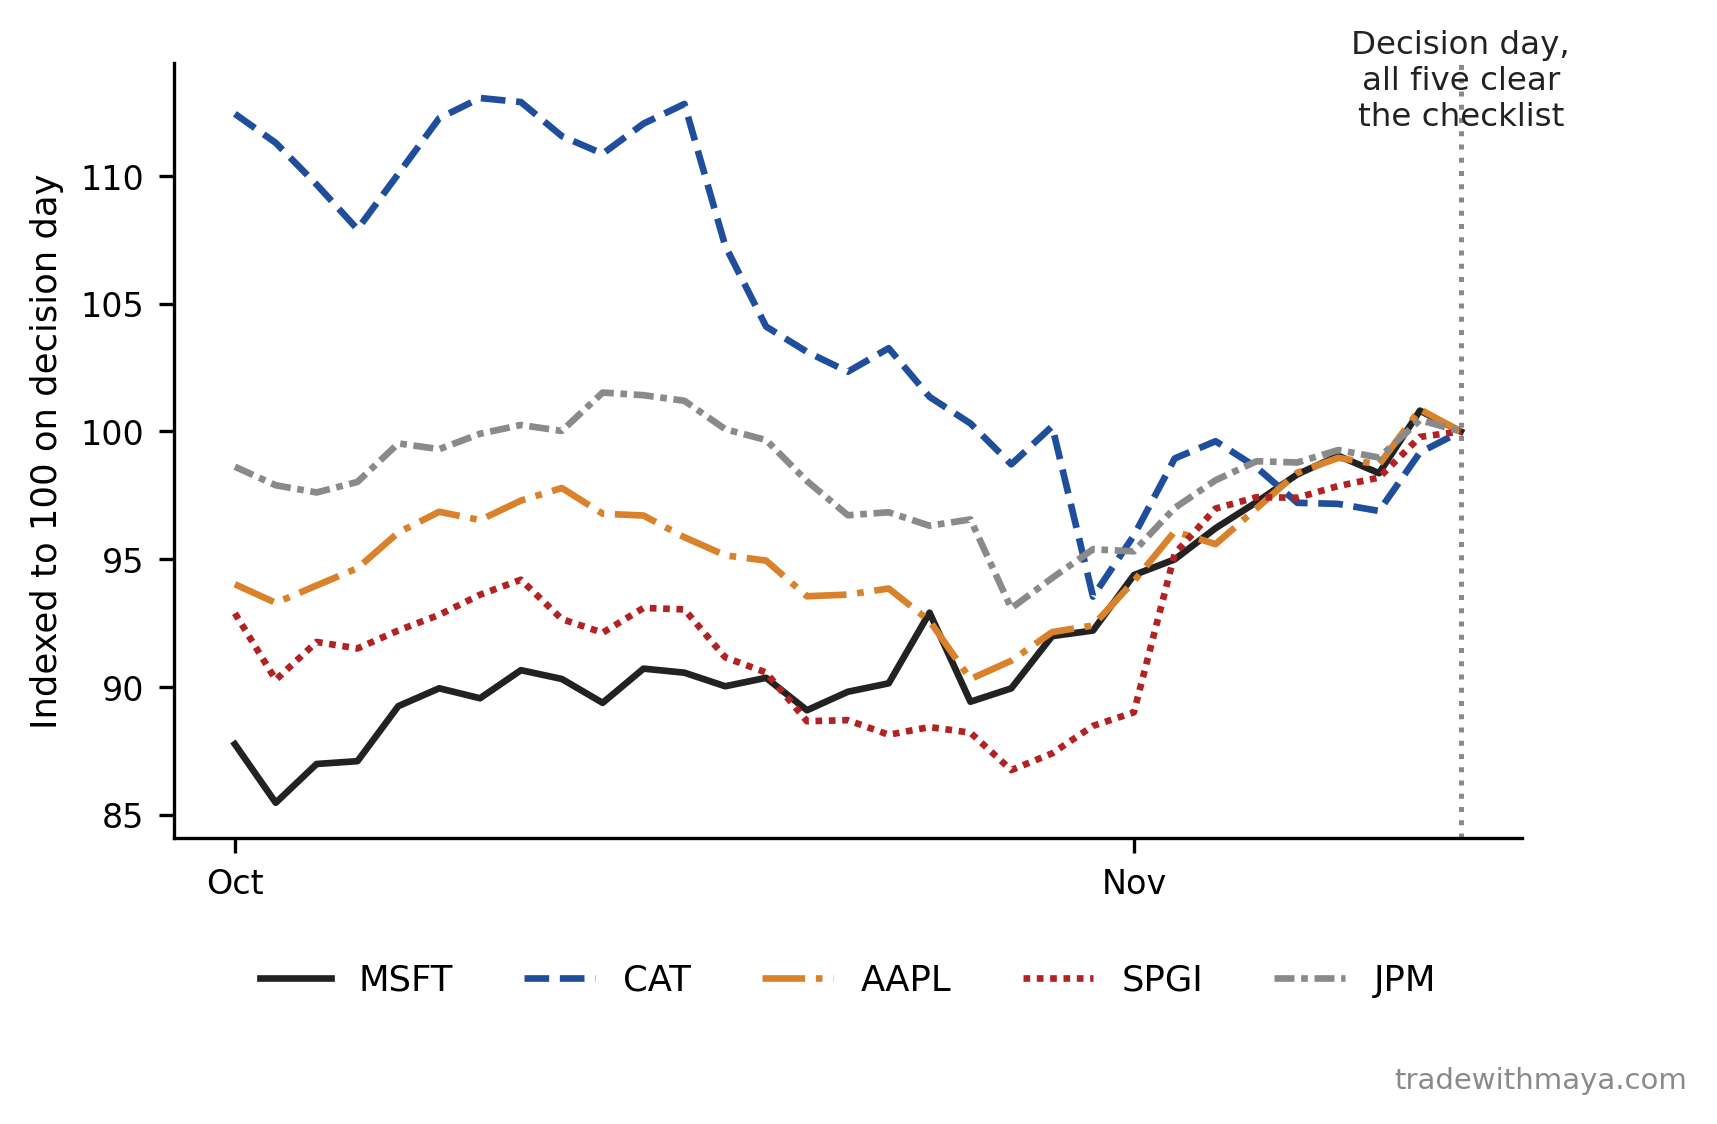
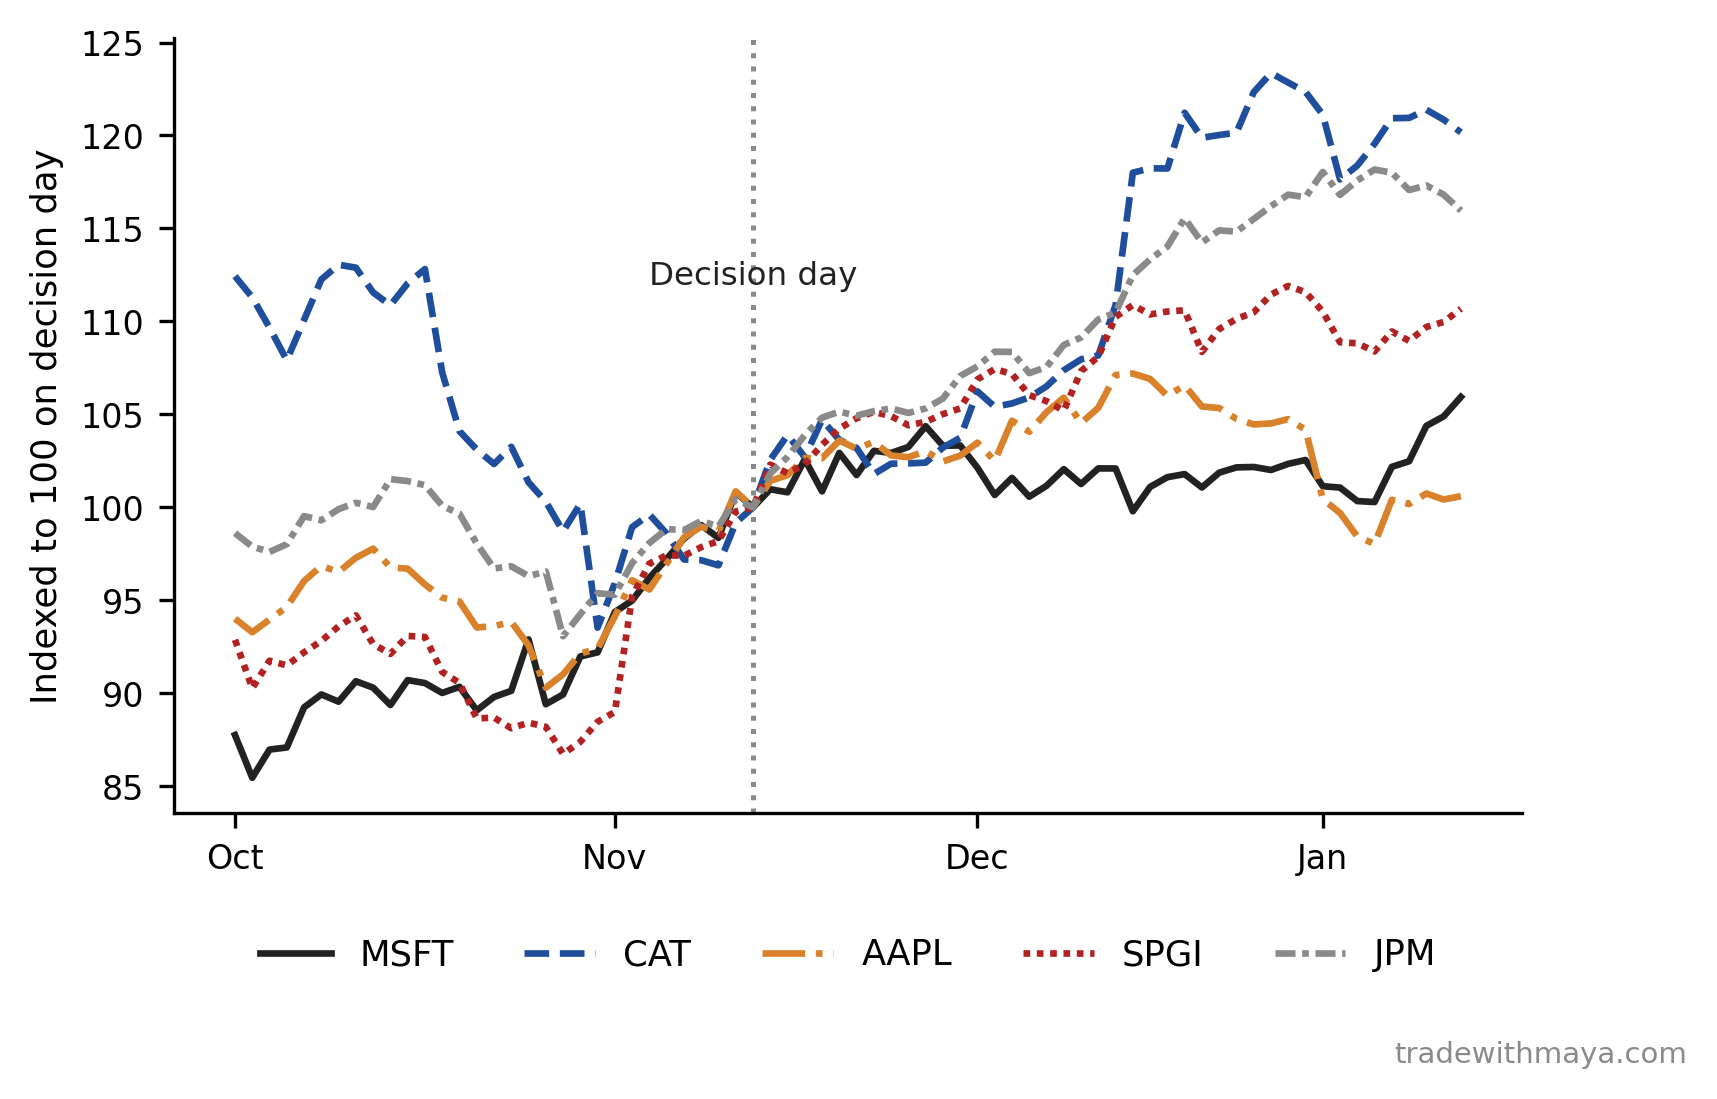
Five tickers, five different sectors, all clearing the checklist on the same real morning, rebased to 100 on that day.
Five tickers, five different sectors, all clearing the checklist on the same real morning, rebased to 100 on that day. Download full size
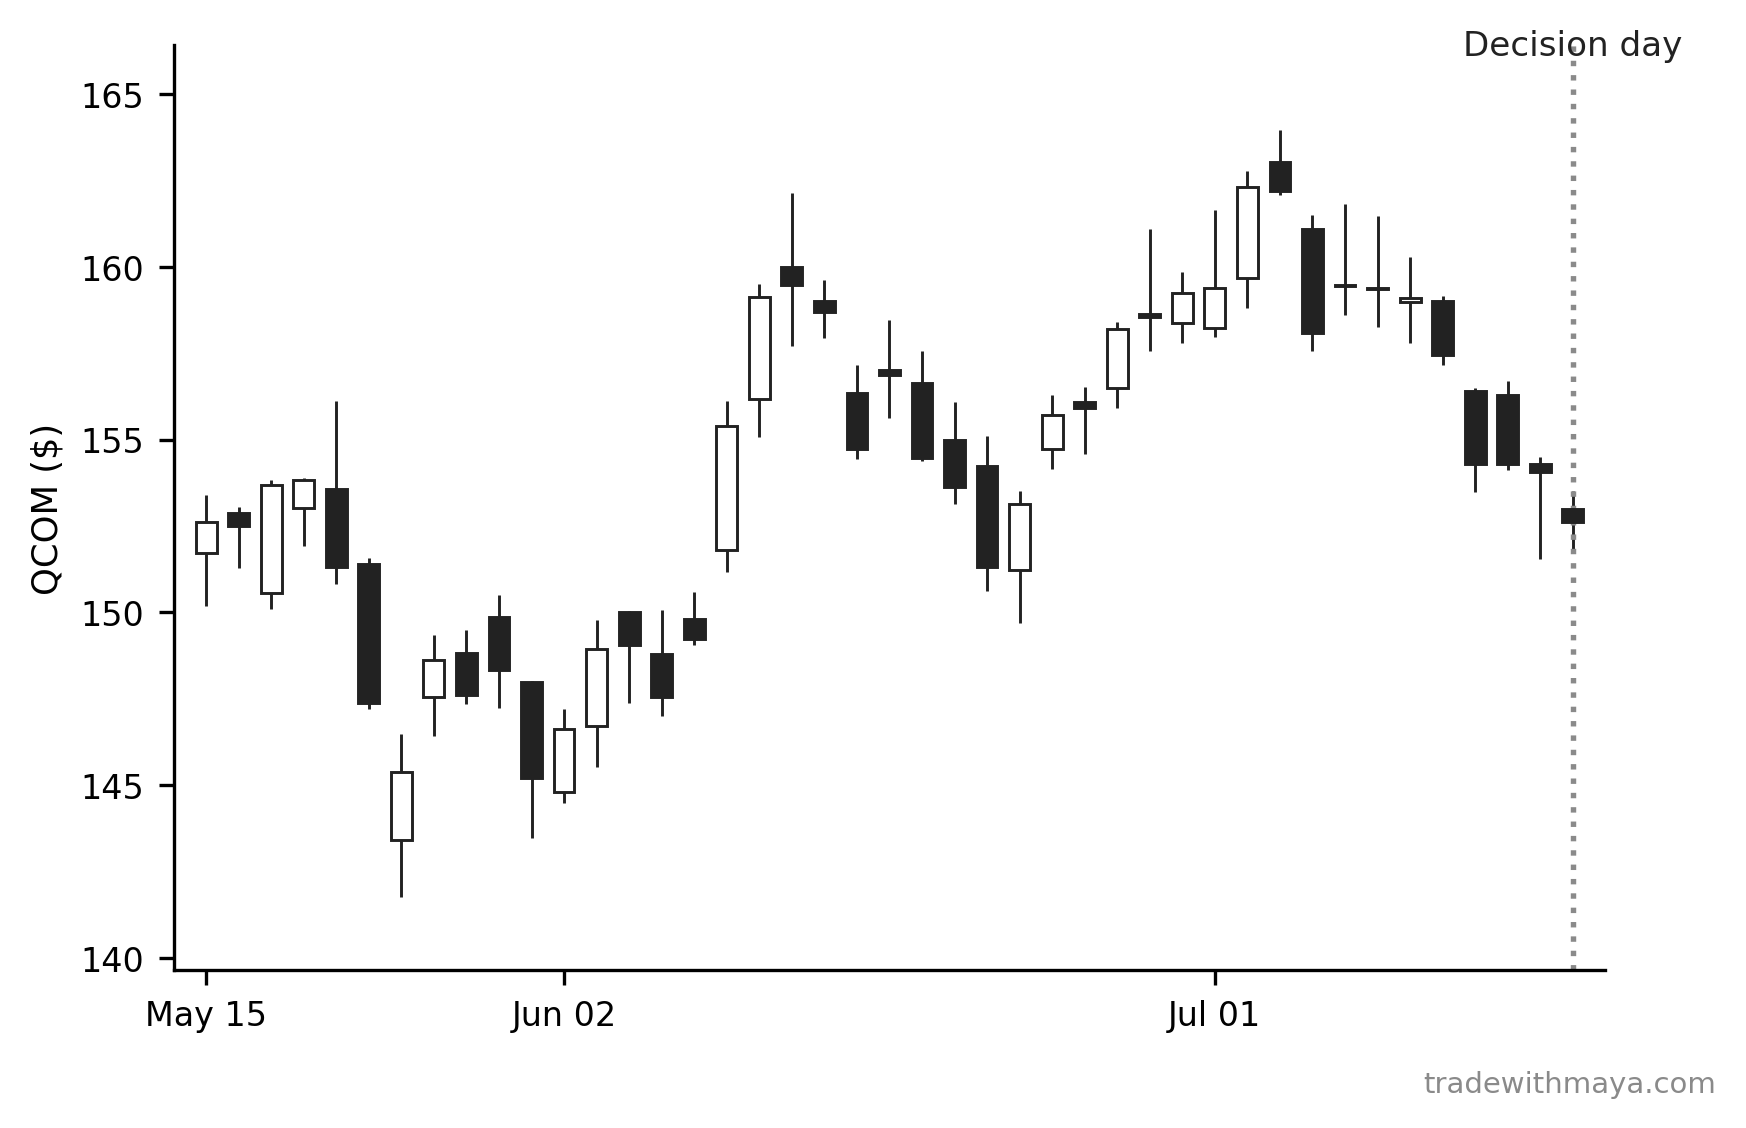
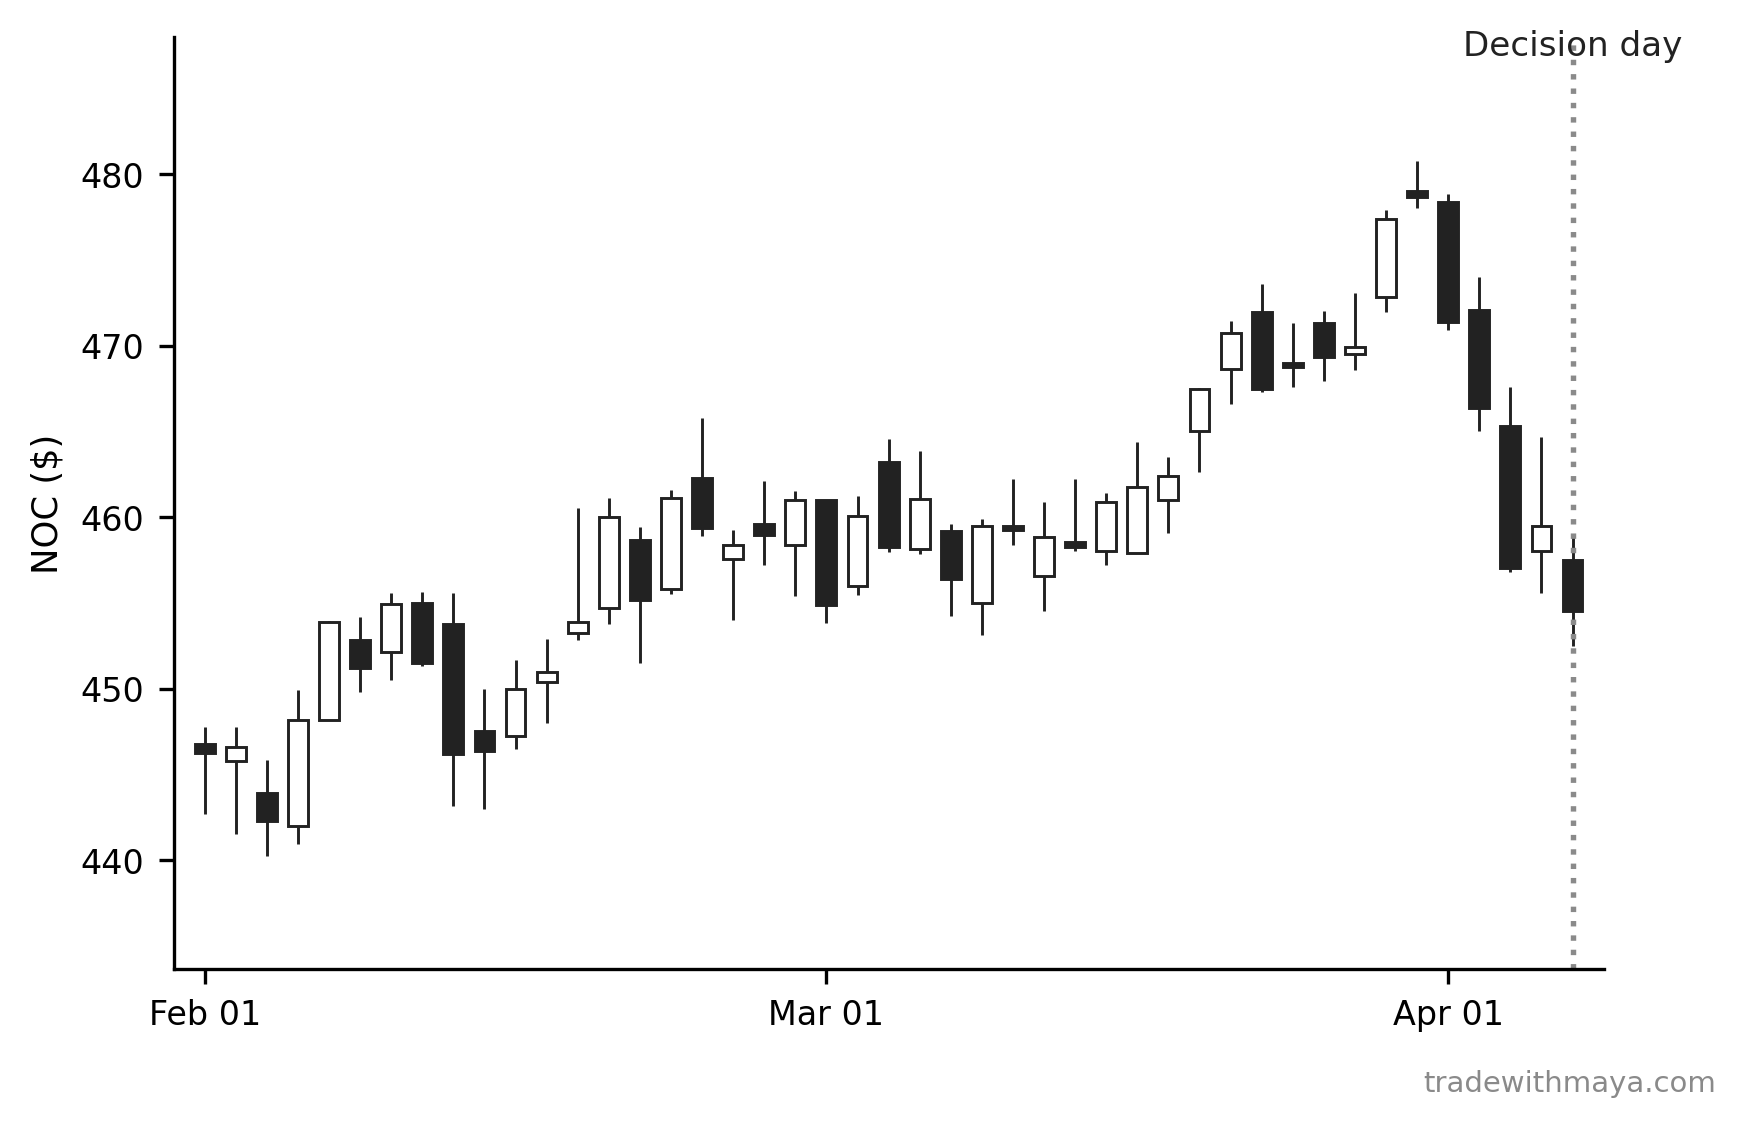
A stock on decision day.
A stock on decision day. Download full size
A position three weeks into the trade.
A position three weeks into the trade. Download full size
A position since entry.
A position since entry. Download full size
A position that entered on a steady uptrend and has since rolled over.
A position that entered on a steady uptrend and has since rolled over. Download full size
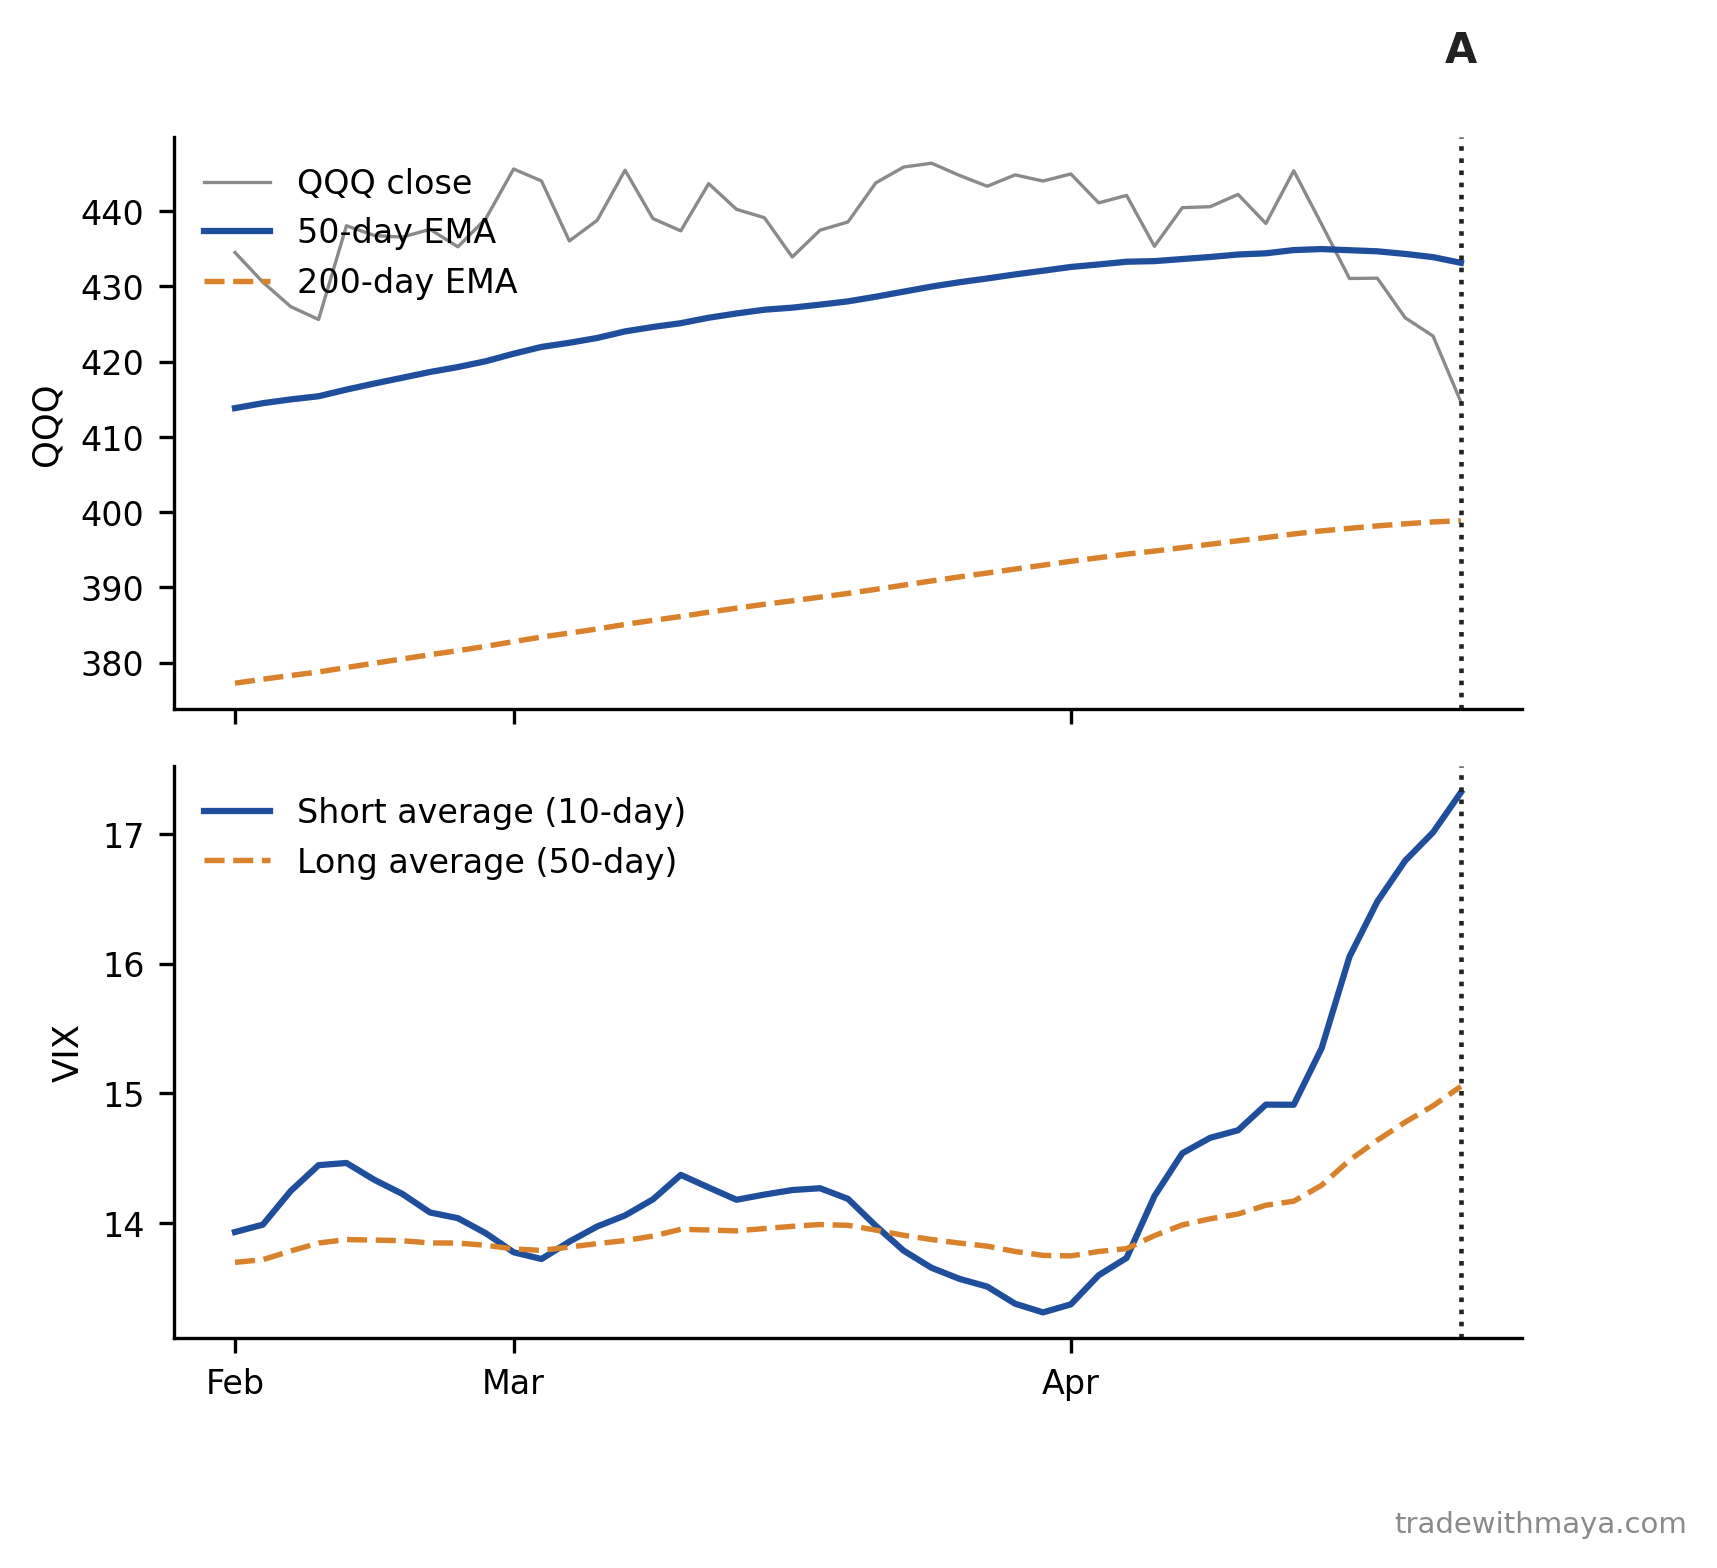
QQQ's trend and VIX's fear gauge leading up to morning A, and nothing after it.
QQQ's trend and VIX's fear gauge leading up to morning A, and nothing after it. Download full size
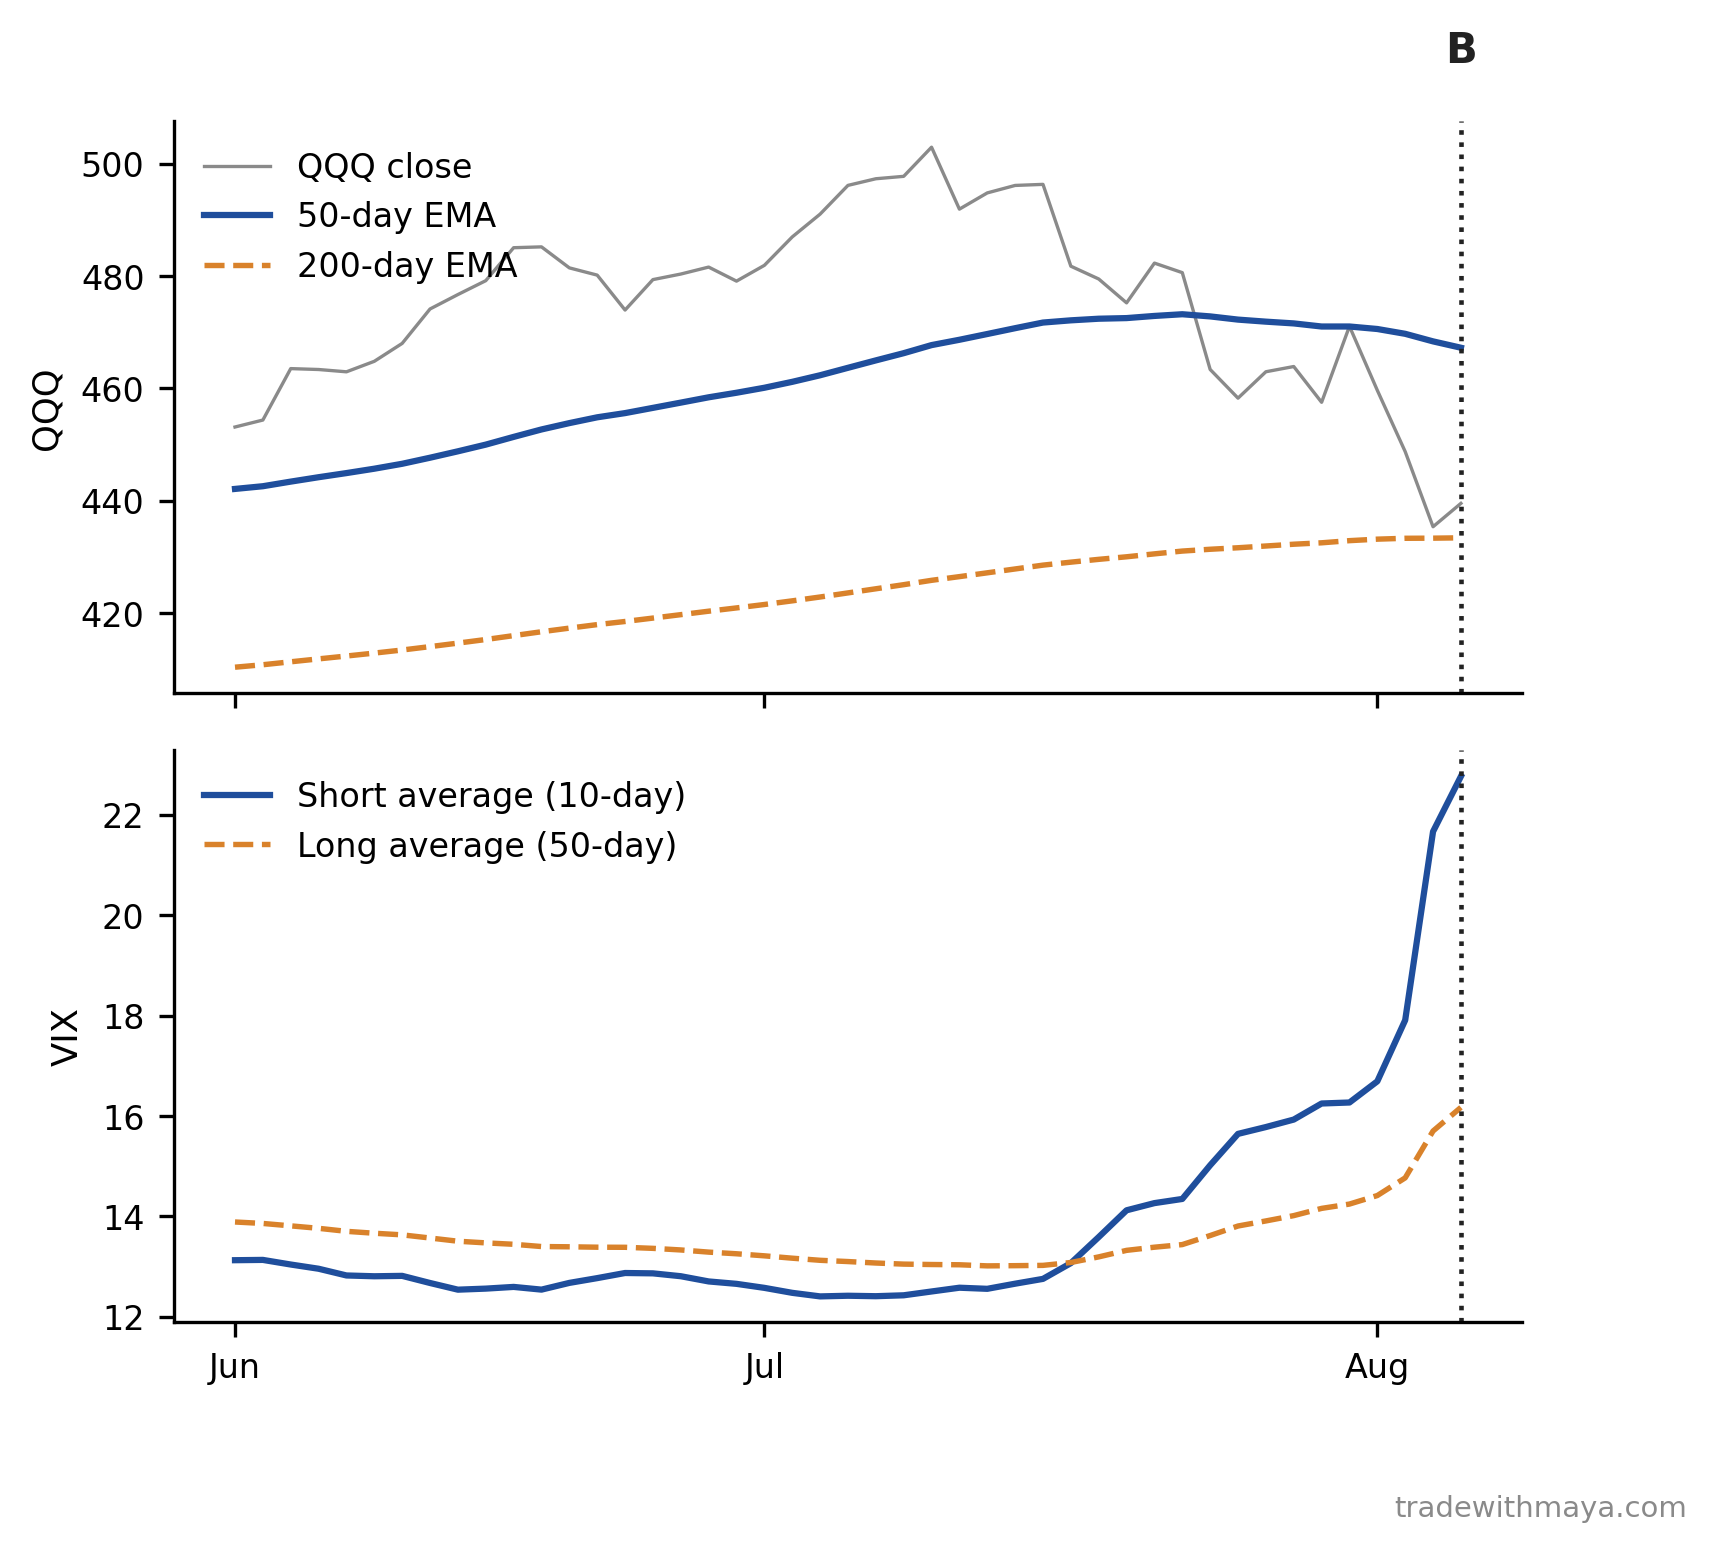
QQQ's trend and VIX's fear gauge leading up to morning B, and nothing after it.
QQQ's trend and VIX's fear gauge leading up to morning B, and nothing after it. Download full size
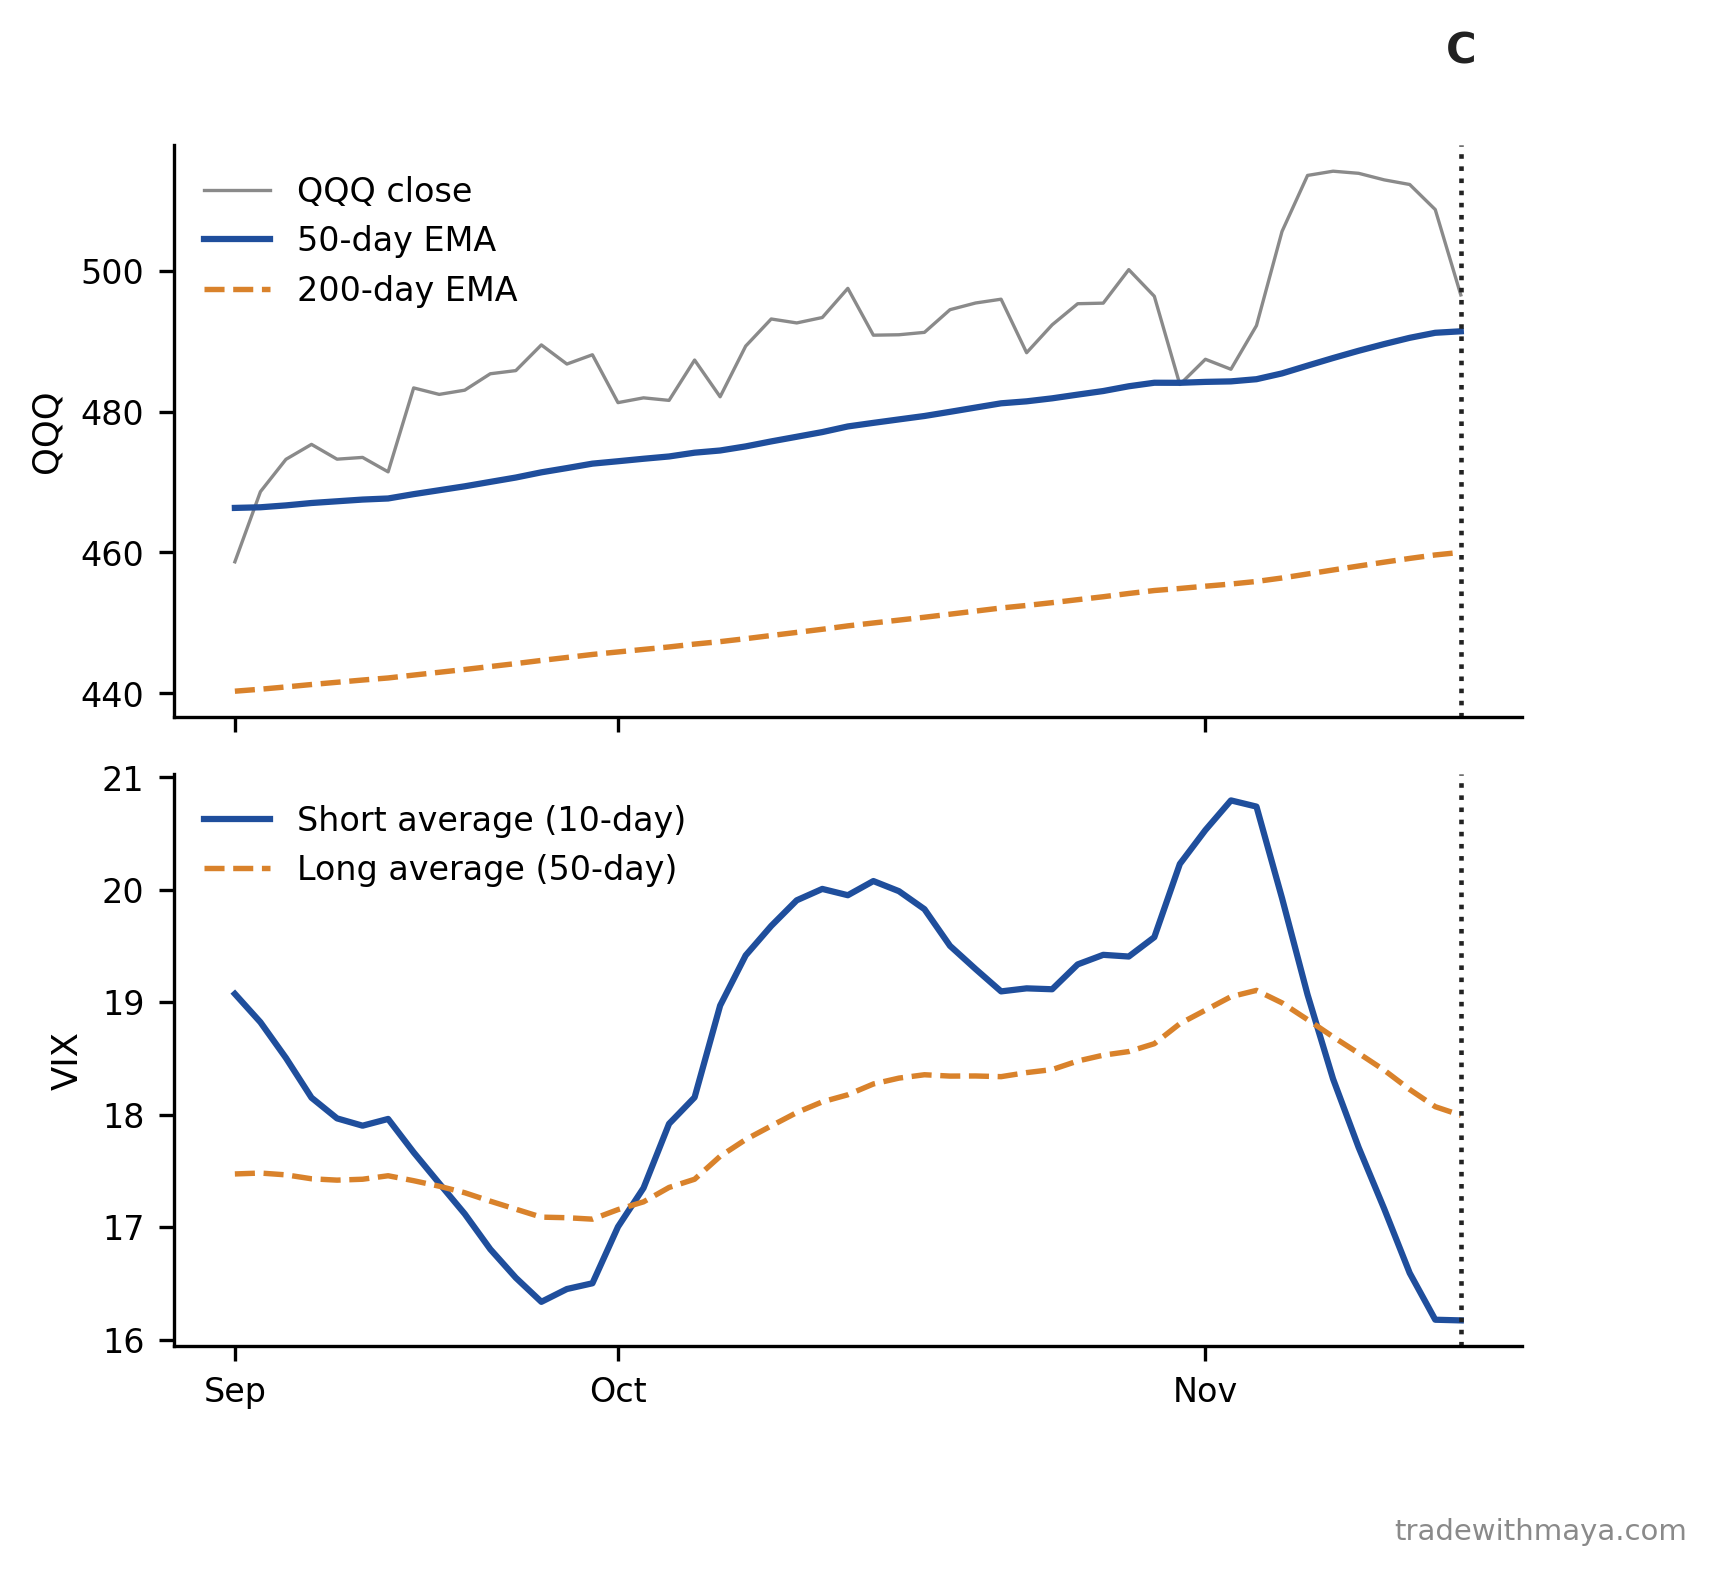
QQQ's trend and VIX's fear gauge leading up to morning C, and nothing after it.
QQQ's trend and VIX's fear gauge leading up to morning C, and nothing after it. Download full size
The same five tickers, now shown through two months after decision day.
The same five tickers, now shown through two months after decision day. Download full size
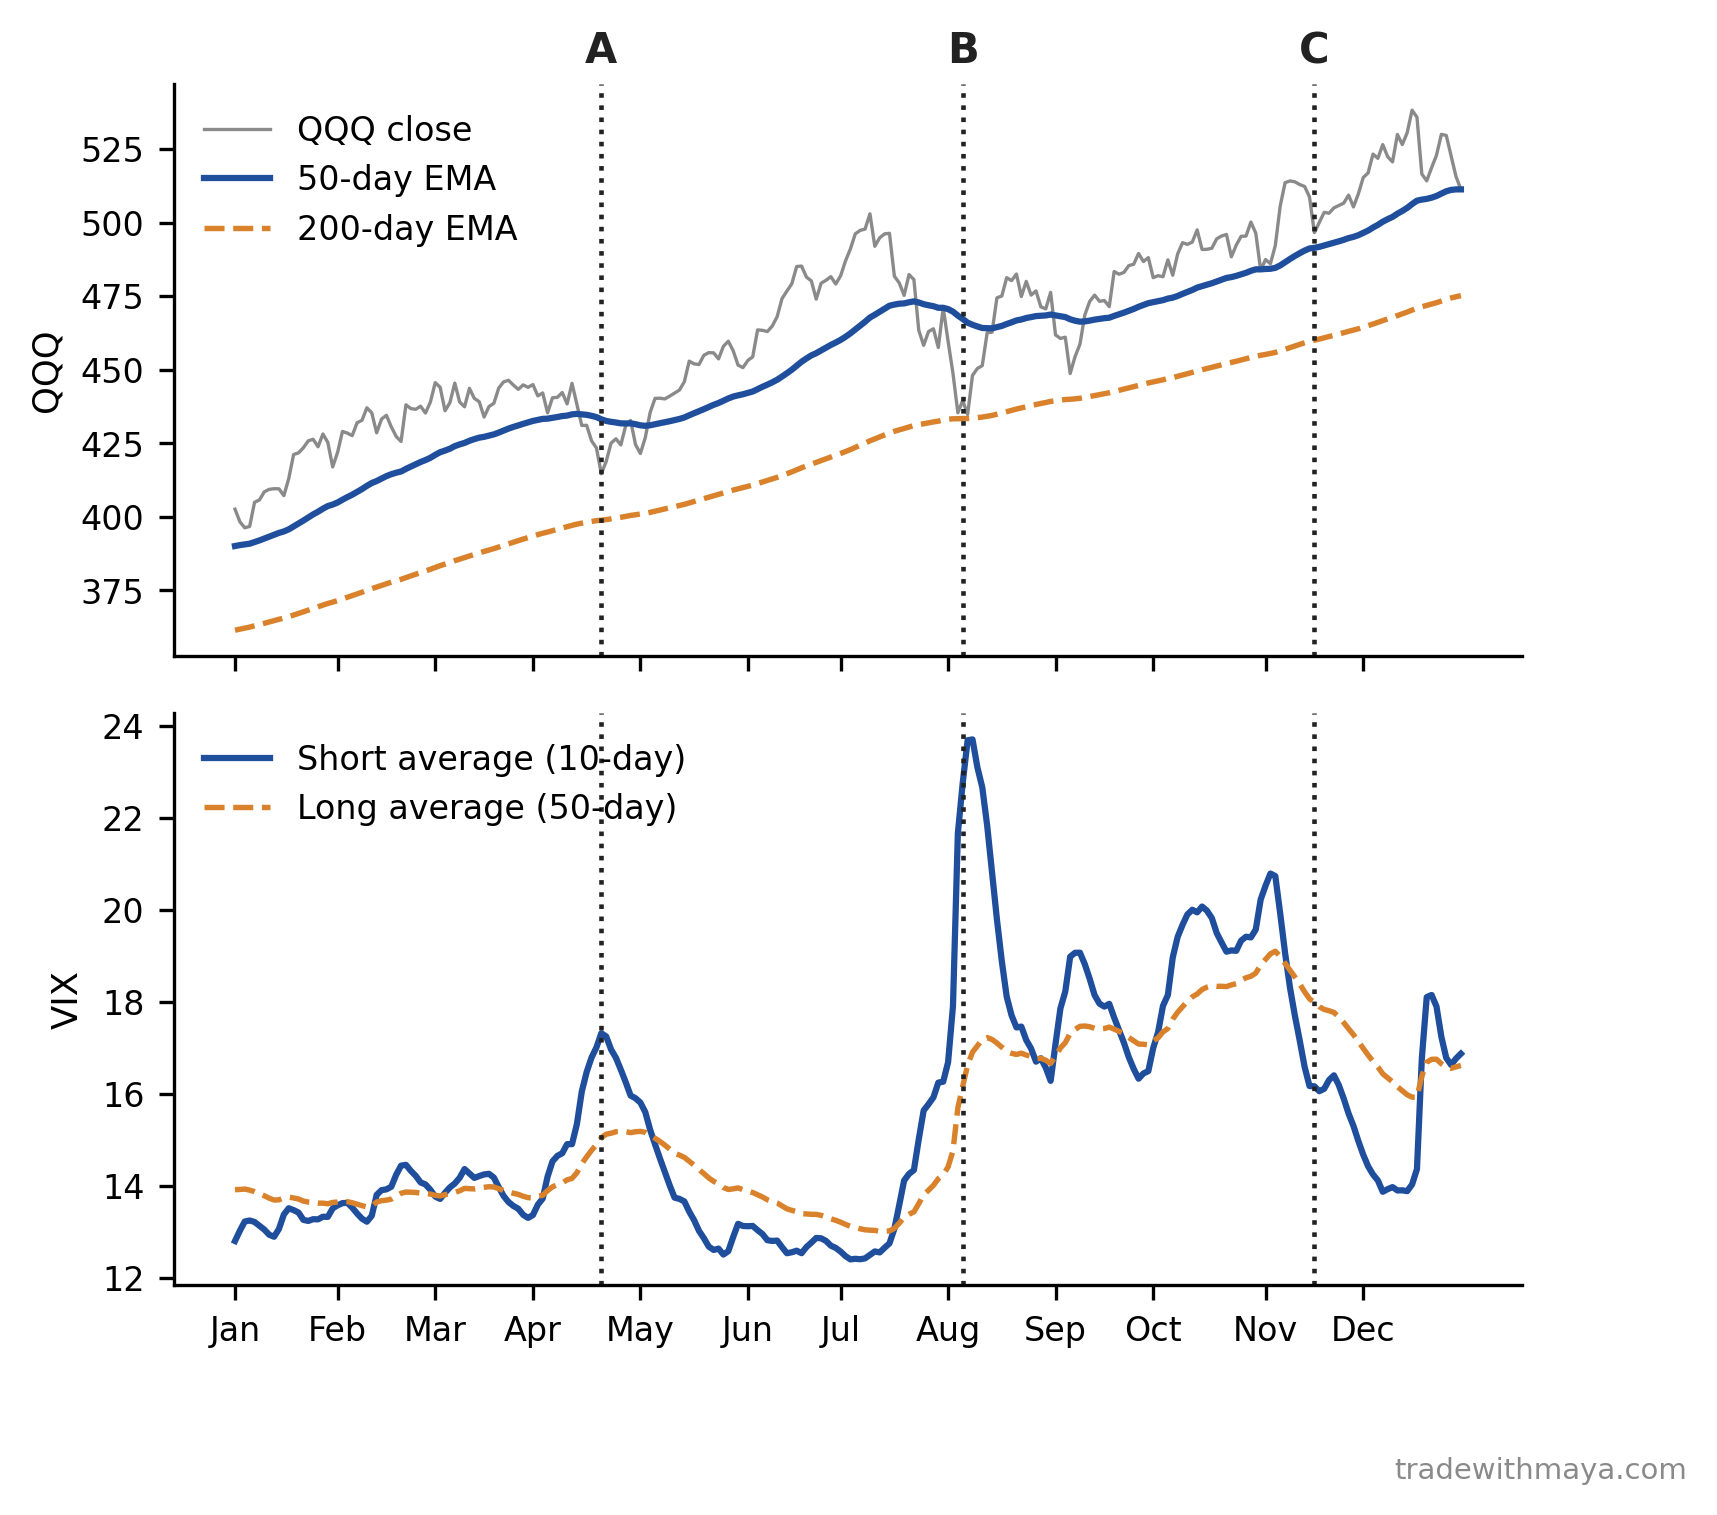
QQQ's trend and VIX's fear gauge across the full year, with all three mornings marked together.
QQQ's trend and VIX's fear gauge across the full year, with all three mornings marked together. Download full size

See it running live

These images come from the research behind Maya, the automated trading system at TradeWithMaya.com. Members see its trades as they happen, every entry and every exit.

See membership options

Code from the book

Every code example from the backtesting chapter, in full. Click Copy on any block and paste it straight into TradingView or QuantConnect. Results shown in the book come from AAPL, daily bars, 2019 through 2025. Backtests are hypothetical, and past results do not guarantee future results. Nothing here is investment advice.

Example 1. Three Down Days

The complete template. Paste the Pine Script into a new strategy in TradingView's Pine Editor. Paste the C# into a new C# algorithm in QuantConnect, replacing everything in the file. Then click Backtest.

Pine Script (TradingView)
//@version=6
strategy("Three Down Days", overlay=true, default_qty_type=strategy.percent_of_equity, default_qty_value=100)
startDate = timestamp("2019-01-01")
endDate = timestamp("2025-12-31")
inWindow = time >= startDate and time <= endDate
qqqClose = request.security("QQQ", "D", close)
qqqEma50 = ta.ema(qqqClose, 50)
qqqEma200 = ta.ema(qqqClose, 200)
marketOK = qqqEma50 > qqqEma200
threeDown = close < close[1] and close[1] < close[2] and close[2] < close[3]
signal = marketOK and threeDown and inWindow
var int entryBar = na
if signal and strategy.position_size == 0
    strategy.entry("Long", strategy.long)
if strategy.position_size > 0 and na(entryBar)
    entryBar := bar_index
exitNow = strategy.position_size > 0 and not na(entryBar) and bar_index - entryBar >= 20
if exitNow
    strategy.close("Long")
entryBar := exitNow ? na : entryBar
C# (QuantConnect)
using System;
using QuantConnect.Data;
using QuantConnect.Data.Market;
using QuantConnect.Indicators;

namespace QuantConnect.Algorithm.CSharp
{
    public class ThreeDownDays : QCAlgorithm
    {
        private Symbol _aapl;
        private Symbol _qqq;
        private ExponentialMovingAverage _ema50;
        private ExponentialMovingAverage _ema200;
        private RollingWindow<decimal> _closes = new RollingWindow<decimal>(4);
        private int _daysInTrade = -1;

        public override void Initialize()
        {
            SetStartDate(2019, 1, 1);
            SetEndDate(2025, 12, 31);
            SetCash(100000);

            _aapl = AddEquity("AAPL", Resolution.Daily).Symbol;
            _qqq = AddEquity("QQQ", Resolution.Daily).Symbol;

            _ema50 = EMA(_qqq, 50, Resolution.Daily);
            _ema200 = EMA(_qqq, 200, Resolution.Daily);
        }

        public override void OnData(Slice slice)
        {
            if (!slice.Bars.ContainsKey(_aapl)) return;
            _closes.Add(slice.Bars[_aapl].Close);

            if (Portfolio[_aapl].Invested)
            {
                _daysInTrade++;
                if (_daysInTrade >= 20)
                {
                    Liquidate(_aapl);
                    _daysInTrade = -1;
                }
                return;
            }

            if (!_closes.IsReady || !_ema50.IsReady || !_ema200.IsReady) return;

            bool marketOk = _ema50 > _ema200;
            bool threeDown = _closes[0] < _closes[1] && _closes[1] < _closes[2] && _closes[2] < _closes[3];

            if (marketOk && threeDown)
            {
                SetHoldings(_aapl, 1.0);
                _daysInTrade = 0;
            }
        }
    }
}

MACD crossover

A complete, ready-to-run version. Same paste steps as above. Nothing else to add or edit.

Pine Script (TradingView)
//@version=6
strategy("MACD Crossover", overlay=true, default_qty_type=strategy.percent_of_equity, default_qty_value=100)
startDate = timestamp("2019-01-01")
endDate = timestamp("2025-12-31")
inWindow = time >= startDate and time <= endDate
qqqClose = request.security("QQQ", "D", close)
qqqEma50 = ta.ema(qqqClose, 50)
qqqEma200 = ta.ema(qqqClose, 200)
marketOK = qqqEma50 > qqqEma200
[macdLine, signalLine, _] = ta.macd(close, 12, 26, 9)
signal = marketOK and ta.crossover(macdLine, signalLine) and inWindow
var int entryBar = na
if signal and strategy.position_size == 0
    strategy.entry("Long", strategy.long)
if strategy.position_size > 0 and na(entryBar)
    entryBar := bar_index
exitNow = strategy.position_size > 0 and not na(entryBar) and bar_index - entryBar >= 20
if exitNow
    strategy.close("Long")
entryBar := exitNow ? na : entryBar
C# (QuantConnect)
using System;
using QuantConnect.Data;
using QuantConnect.Data.Market;
using QuantConnect.Indicators;

namespace QuantConnect.Algorithm.CSharp
{
    public class MacdCrossover : QCAlgorithm
    {
        private Symbol _aapl;
        private Symbol _qqq;
        private ExponentialMovingAverage _ema50;
        private ExponentialMovingAverage _ema200;
        private MovingAverageConvergenceDivergence _macd;
        private bool _macdWasBelow;
        private int _daysInTrade = -1;

        public override void Initialize()
        {
            SetStartDate(2019, 1, 1);
            SetEndDate(2025, 12, 31);
            SetCash(100000);

            _aapl = AddEquity("AAPL", Resolution.Daily).Symbol;
            _macd = MACD(_aapl, 12, 26, 9, MovingAverageType.Exponential, Resolution.Daily);
            _qqq = AddEquity("QQQ", Resolution.Daily).Symbol;
            _ema50 = EMA(_qqq, 50, Resolution.Daily);
            _ema200 = EMA(_qqq, 200, Resolution.Daily);
        }

        public override void OnData(Slice slice)
        {
            if (!slice.Bars.ContainsKey(_aapl)) return;

            // Update indicator state on every bar, even while a trade is open, so a crossover is never missed.
            if (!_macd.IsReady) return;
            decimal macdLine = _macd.Current.Value;
            decimal signalLine = _macd.Signal.Current.Value;
            bool crossedUp = _macdWasBelow && macdLine > signalLine;
            _macdWasBelow = macdLine <= signalLine;

            if (Portfolio[_aapl].Invested)
            {
                _daysInTrade++;
                if (_daysInTrade >= 20)
                {
                    Liquidate(_aapl);
                    _daysInTrade = -1;
                }
                return;
            }

            if (!_ema50.IsReady || !_ema200.IsReady) return;
            bool marketOk = _ema50.Current.Value > _ema200.Current.Value;

            if (marketOk && crossedUp)
            {
                SetHoldings(_aapl, 1.0);
                _daysInTrade = 0;
            }
        }
    }
}

RSI oversold bounce

A complete, ready-to-run version. Same paste steps as above. Nothing else to add or edit.

Pine Script (TradingView)
//@version=6
strategy("RSI Oversold Bounce", overlay=true, default_qty_type=strategy.percent_of_equity, default_qty_value=100)
startDate = timestamp("2019-01-01")
endDate = timestamp("2025-12-31")
inWindow = time >= startDate and time <= endDate
qqqClose = request.security("QQQ", "D", close)
qqqEma50 = ta.ema(qqqClose, 50)
qqqEma200 = ta.ema(qqqClose, 200)
marketOK = qqqEma50 > qqqEma200
rsiValue = ta.rsi(close, 14)
signal = marketOK and ta.crossover(rsiValue, 30) and inWindow
var int entryBar = na
if signal and strategy.position_size == 0
    strategy.entry("Long", strategy.long)
if strategy.position_size > 0 and na(entryBar)
    entryBar := bar_index
exitNow = strategy.position_size > 0 and not na(entryBar) and bar_index - entryBar >= 20
if exitNow
    strategy.close("Long")
entryBar := exitNow ? na : entryBar
C# (QuantConnect)
using System;
using QuantConnect.Data;
using QuantConnect.Data.Market;
using QuantConnect.Indicators;

namespace QuantConnect.Algorithm.CSharp
{
    public class RsiOversoldBounce : QCAlgorithm
    {
        private Symbol _aapl;
        private Symbol _qqq;
        private ExponentialMovingAverage _ema50;
        private ExponentialMovingAverage _ema200;
        private RelativeStrengthIndex _rsi;
        private bool _wasOversold;
        private int _daysInTrade = -1;

        public override void Initialize()
        {
            SetStartDate(2019, 1, 1);
            SetEndDate(2025, 12, 31);
            SetCash(100000);

            _aapl = AddEquity("AAPL", Resolution.Daily).Symbol;
            _rsi = RSI(_aapl, 14, MovingAverageType.Wilders, Resolution.Daily);
            _qqq = AddEquity("QQQ", Resolution.Daily).Symbol;
            _ema50 = EMA(_qqq, 50, Resolution.Daily);
            _ema200 = EMA(_qqq, 200, Resolution.Daily);
        }

        public override void OnData(Slice slice)
        {
            if (!slice.Bars.ContainsKey(_aapl)) return;

            // Update indicator state on every bar, even while a trade is open, so a crossover is never missed.
            if (!_rsi.IsReady) return;
            decimal rsiValue = _rsi.Current.Value;
            bool crossedBackAbove30 = _wasOversold && rsiValue > 30m;
            _wasOversold = rsiValue < 30m;

            if (Portfolio[_aapl].Invested)
            {
                _daysInTrade++;
                if (_daysInTrade >= 20)
                {
                    Liquidate(_aapl);
                    _daysInTrade = -1;
                }
                return;
            }

            if (!_ema50.IsReady || !_ema200.IsReady) return;
            bool marketOk = _ema50.Current.Value > _ema200.Current.Value;

            if (marketOk && crossedBackAbove30)
            {
                SetHoldings(_aapl, 1.0);
                _daysInTrade = 0;
            }
        }
    }
}

Golden cross

A complete, ready-to-run version. Same paste steps as above. This one does not use the QQQ market check, matching the chapter.

Pine Script (TradingView)
//@version=6
strategy("Golden Cross", overlay=true, default_qty_type=strategy.percent_of_equity, default_qty_value=100)
startDate = timestamp("2019-01-01")
endDate = timestamp("2025-12-31")
inWindow = time >= startDate and time <= endDate
sma50 = ta.sma(close, 50)
sma200 = ta.sma(close, 200)
signal = ta.crossover(sma50, sma200) and inWindow
var int entryBar = na
if signal and strategy.position_size == 0
    strategy.entry("Long", strategy.long)
if strategy.position_size > 0 and na(entryBar)
    entryBar := bar_index
exitNow = strategy.position_size > 0 and not na(entryBar) and bar_index - entryBar >= 20
if exitNow
    strategy.close("Long")
entryBar := exitNow ? na : entryBar
C# (QuantConnect)
using System;
using QuantConnect.Data;
using QuantConnect.Data.Market;
using QuantConnect.Indicators;

namespace QuantConnect.Algorithm.CSharp
{
    public class GoldenCross : QCAlgorithm
    {
        private Symbol _aapl;
        private SimpleMovingAverage _sma50;
        private SimpleMovingAverage _sma200;
        private bool _wasBelow;
        private int _daysInTrade = -1;

        public override void Initialize()
        {
            SetStartDate(2019, 1, 1);
            SetEndDate(2025, 12, 31);
            SetCash(100000);

            _aapl = AddEquity("AAPL", Resolution.Daily).Symbol;
            _sma50 = SMA(_aapl, 50, Resolution.Daily);
            _sma200 = SMA(_aapl, 200, Resolution.Daily);
        }

        public override void OnData(Slice slice)
        {
            if (!slice.Bars.ContainsKey(_aapl)) return;

            // Update indicator state on every bar, even while a trade is open, so a crossover is never missed.
            if (!_sma50.IsReady || !_sma200.IsReady) return;
            bool crossedUp = _wasBelow && _sma50.Current.Value > _sma200.Current.Value;
            _wasBelow = _sma50.Current.Value <= _sma200.Current.Value;

            if (Portfolio[_aapl].Invested)
            {
                _daysInTrade++;
                if (_daysInTrade >= 20)
                {
                    Liquidate(_aapl);
                    _daysInTrade = -1;
                }
                return;
            }

            if (crossedUp)
            {
                SetHoldings(_aapl, 1.0);
                _daysInTrade = 0;
            }
        }
    }
}

Bollinger Band touch

A complete, ready-to-run version. Same paste steps as above. Nothing else to add or edit.

Pine Script (TradingView)
//@version=6
strategy("Bollinger Band Touch", overlay=true, default_qty_type=strategy.percent_of_equity, default_qty_value=100)
startDate = timestamp("2019-01-01")
endDate = timestamp("2025-12-31")
inWindow = time >= startDate and time <= endDate
qqqClose = request.security("QQQ", "D", close)
qqqEma50 = ta.ema(qqqClose, 50)
qqqEma200 = ta.ema(qqqClose, 200)
marketOK = qqqEma50 > qqqEma200
[_, _, lowerBand] = ta.bb(close, 20, 2)
signal = marketOK and close <= lowerBand and inWindow
var int entryBar = na
if signal and strategy.position_size == 0
    strategy.entry("Long", strategy.long)
if strategy.position_size > 0 and na(entryBar)
    entryBar := bar_index
exitNow = strategy.position_size > 0 and not na(entryBar) and bar_index - entryBar >= 20
if exitNow
    strategy.close("Long")
entryBar := exitNow ? na : entryBar
C# (QuantConnect)
using System;
using QuantConnect.Data;
using QuantConnect.Data.Market;
using QuantConnect.Indicators;

namespace QuantConnect.Algorithm.CSharp
{
    public class BollingerBandTouch : QCAlgorithm
    {
        private Symbol _aapl;
        private Symbol _qqq;
        private ExponentialMovingAverage _ema50;
        private ExponentialMovingAverage _ema200;
        private BollingerBands _bb;
        private int _daysInTrade = -1;

        public override void Initialize()
        {
            SetStartDate(2019, 1, 1);
            SetEndDate(2025, 12, 31);
            SetCash(100000);

            _aapl = AddEquity("AAPL", Resolution.Daily).Symbol;
            _bb = BB(_aapl, 20, 2m, MovingAverageType.Simple, Resolution.Daily);
            _qqq = AddEquity("QQQ", Resolution.Daily).Symbol;
            _ema50 = EMA(_qqq, 50, Resolution.Daily);
            _ema200 = EMA(_qqq, 200, Resolution.Daily);
        }

        public override void OnData(Slice slice)
        {
            if (!slice.Bars.ContainsKey(_aapl)) return;

            // Update indicator state on every bar, even while a trade is open, so a crossover is never missed.
            if (!_bb.IsReady) return;
            bool touchedLowerBand = slice.Bars[_aapl].Close <= _bb.LowerBand.Current.Value;

            if (Portfolio[_aapl].Invested)
            {
                _daysInTrade++;
                if (_daysInTrade >= 20)
                {
                    Liquidate(_aapl);
                    _daysInTrade = -1;
                }
                return;
            }

            if (!_ema50.IsReady || !_ema200.IsReady) return;
            bool marketOk = _ema50.Current.Value > _ema200.Current.Value;

            if (marketOk && touchedLowerBand)
            {
                SetHoldings(_aapl, 1.0);
                _daysInTrade = 0;
            }
        }
    }
}

Prefer files? Download everything as a zip: every strategy as a complete, ready-to-run TradingView (.pine) and QuantConnect (.cs) file.

About the author

Nishant Pant has traded for 20 years, the last 15 of them in options, and has taught more than six thousand traders. This is his third book, after the $25K Options Trading Challenge (2019) and Mean Reversion Trading (2022). He built Maya, a fully automated trading system, to put these rules to work, and he wrote this book so you can build your own.

Educational only, not investment advice. Options involve substantial risk, including the loss of the entire amount invested. Charts and results shown are examples drawn from historical data. Backtested results are hypothetical, do not represent actual trading, and past performance does not guarantee future results.