Time in the Market Beats Timing It, and Why You Trade a System
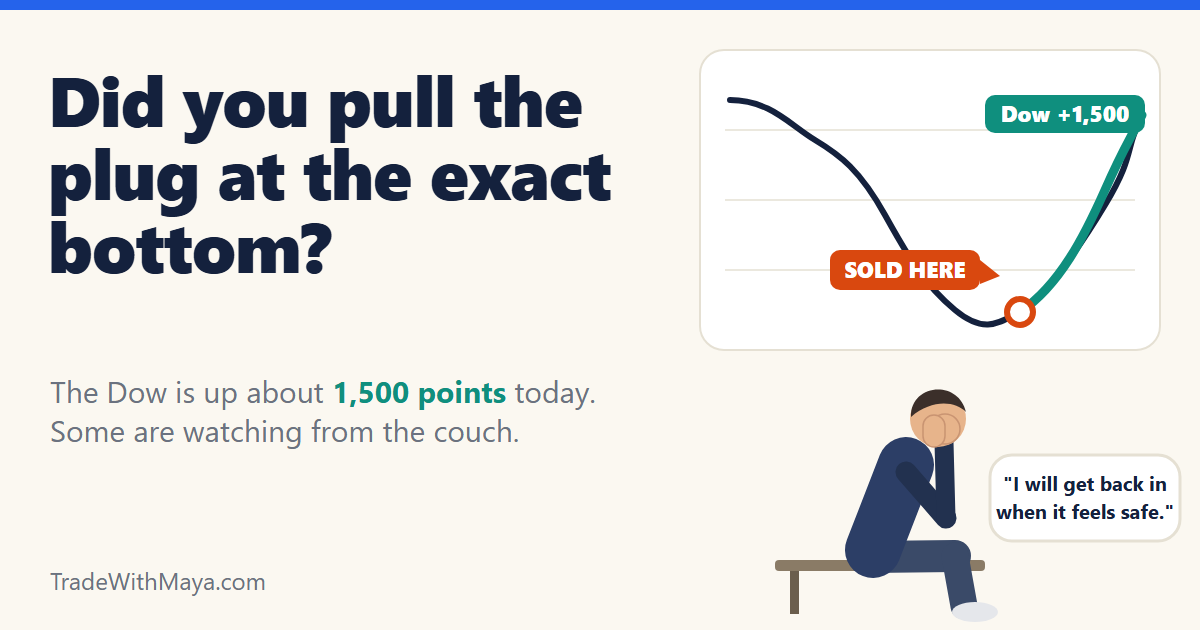
Look at the Dow this morning. It is up about 1,500 points as I write this, after a scare that had plenty of people reaching for the sell button. Somewhere out there is a person who closed their account on the last red day, and I do not say that to be smug. I have been trading since 2006 and I have watched this exact scene play out for as long as I can remember. It is the most human thing in the market, and it costs people more than any bad stock pick.
Nobody rings a bell at the bottom
The trouble is that a bottom looks like the worst day of the year. The headlines are ugly, the volatility index is screaming, and every instinct you own says get out while you still can. So we went back to 1990 and counted every time the S&P 500 fell 15% or more. There were 8 of them, and a year after the low the index was higher all 8 times, including the 2020 crash (up 75%) and the April 2025 low (up 37%).
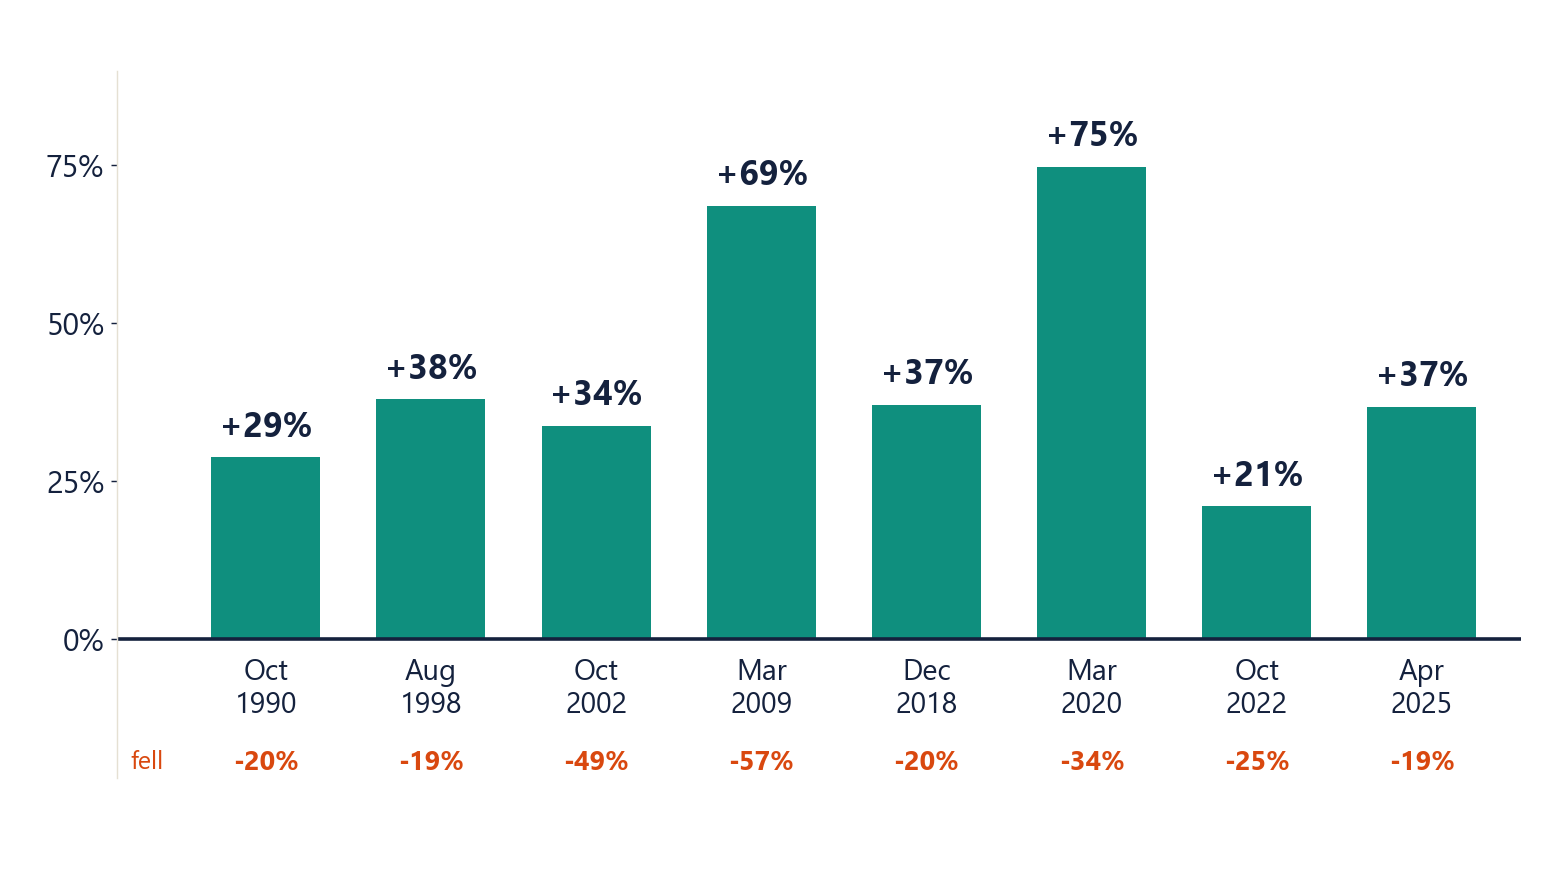
Those are exactly the lows people sold. Selling at the bottom is the one trade humans execute with perfect timing.
It is not just the big crashes
Fair enough, you might say, but those were crashes and most years are not crashes. So we pulled every calendar year of the last ten and measured the worst drop inside each one. 9 of the 10 years had a drop of 5% or more at some point, 5 had a drop of 10% or more, and 2020 had one of 34%. And yet 8 of the 10 years finished higher, including 3 of the 5 that gave us a scare of 10% or worse.
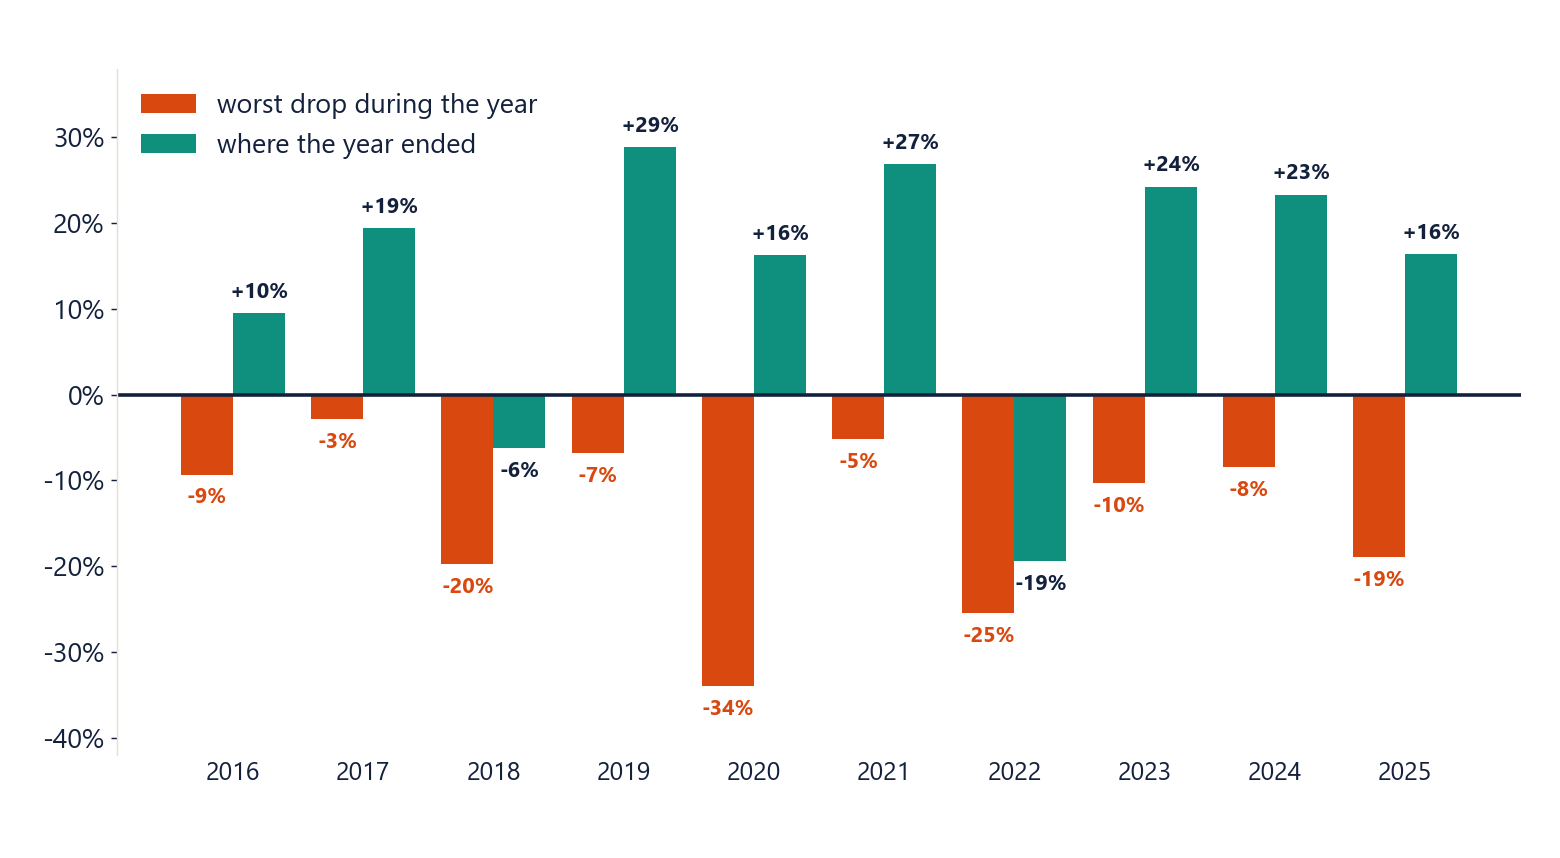
A scary stretch is the cost of admission, not a sign the party is over. If you bailed at every one of those, you handed yourself a lot of chances to be wrong, and the market took every single one of them.
The Nasdaq crowd, this one is for you
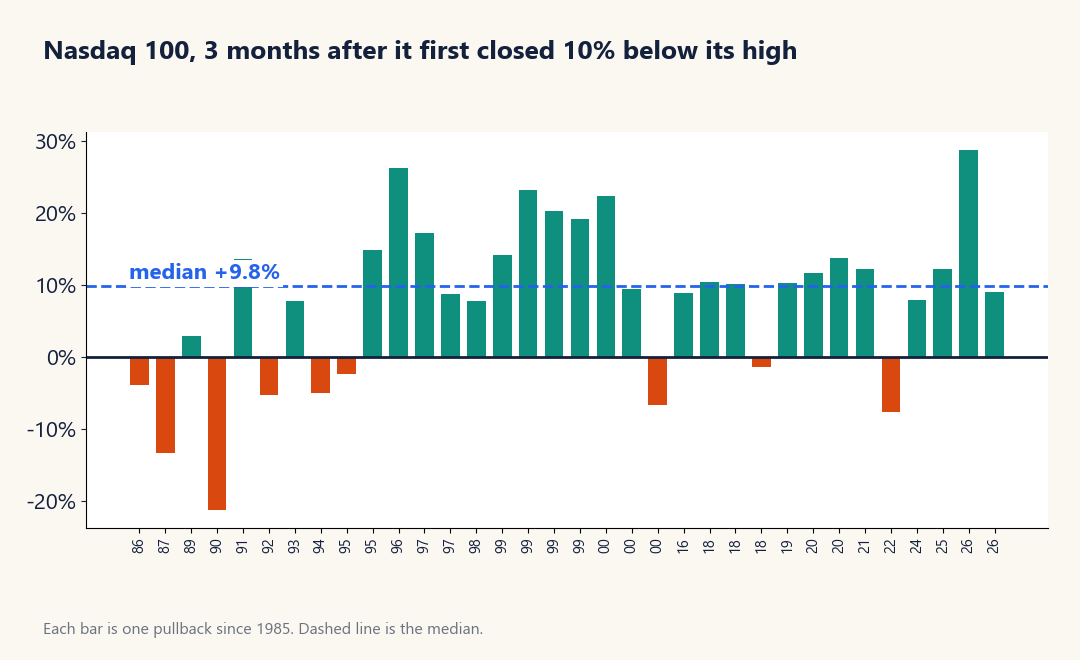
A lot of you trade tech, so we pulled the Nasdaq 100 back to 1985 too. It has had 34 pullbacks of 10% or more, which is roughly one a year, so a correction is closer to a calendar event than a surprise. Three months after the index first closed 10% under its high it was higher 25 of 34 times, with a median gain of 10%. A year later it was higher 26 of 32 times, with a median of 26%. I will not oversell it, though. The worst year-later result was -66%, in 2000, and that one deserves respect.
The best days live next door to the worst
Part of why this is so expensive is that the rebound never sends a calendar invite. Say you put $10,000 in the S&P 500 ten years ago. Stay in, and it grew to about $36,200 (price only, no dividends). Miss just the 10 best days out of roughly 2,512 and it is about $18,900. Miss the 30 best and you are at about $10,400, which is ten years of sitting there for nothing. 8 of those ten best days landed within about two weeks of one of the ten worst, and 7 of them came between March 2 and April 6, 2020, which is precisely when everyone wanted out.
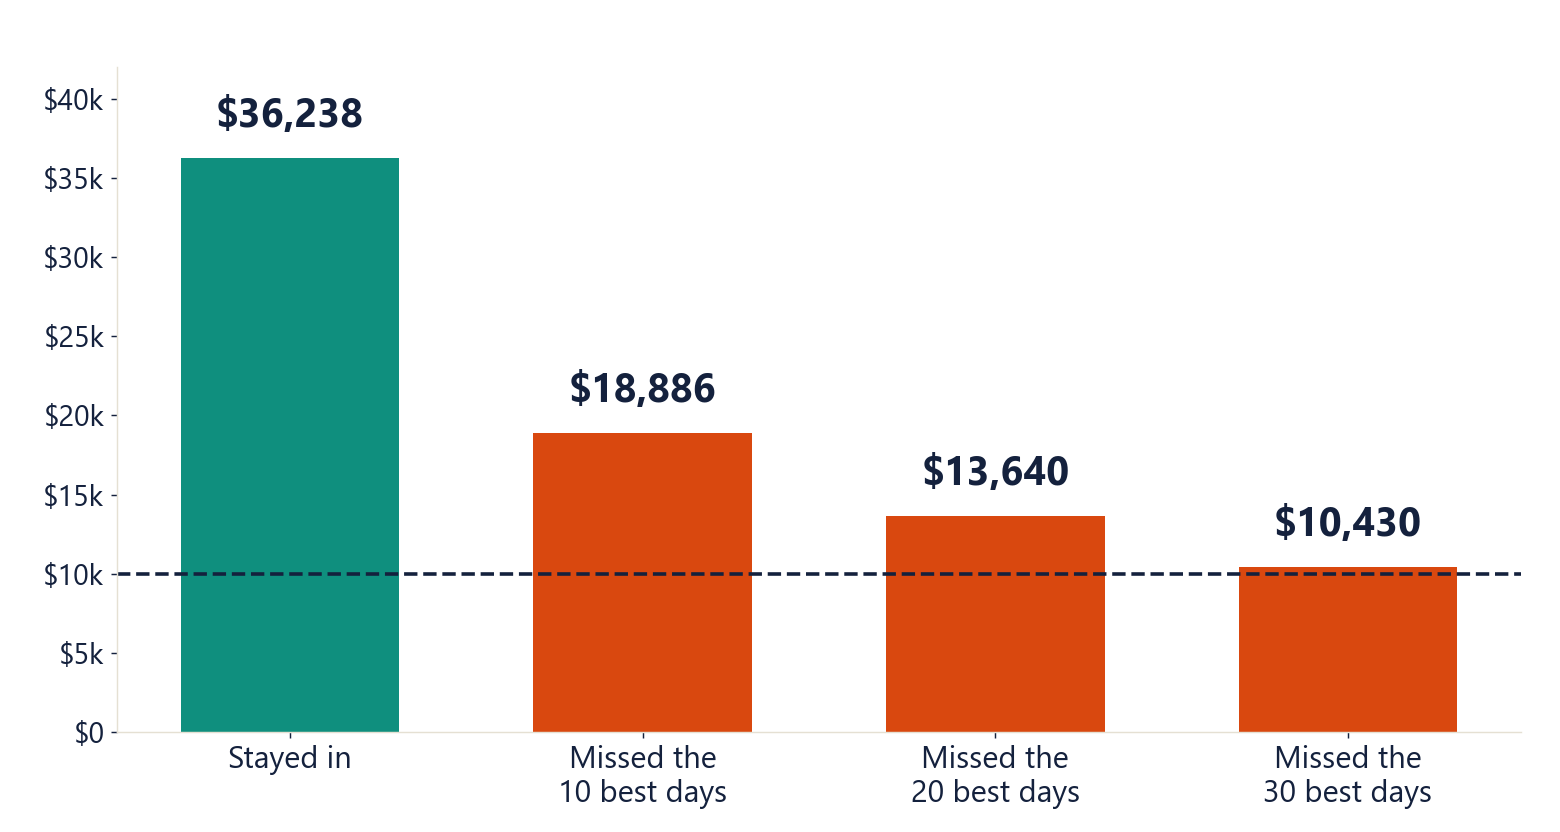
Time in the market beats timing the market, with one catch. You only collect the time if you can stay in the chair, and that is where a system earns its keep.
That is why we backtest
If you are a Maya subscriber and you panicked near a bottom, this part is for you. People hear the word backtest and assume it is a promise about next year. We have never used it that way. We run Maya's rules through history to see how bad a bad stretch can get and what happened after it, because that behavior repeats. Our test covers 2,361 trades from 2019 through 2025 (one contract per trade, so the dollar figures are small), and here is the full table, including the year we would rather skip.
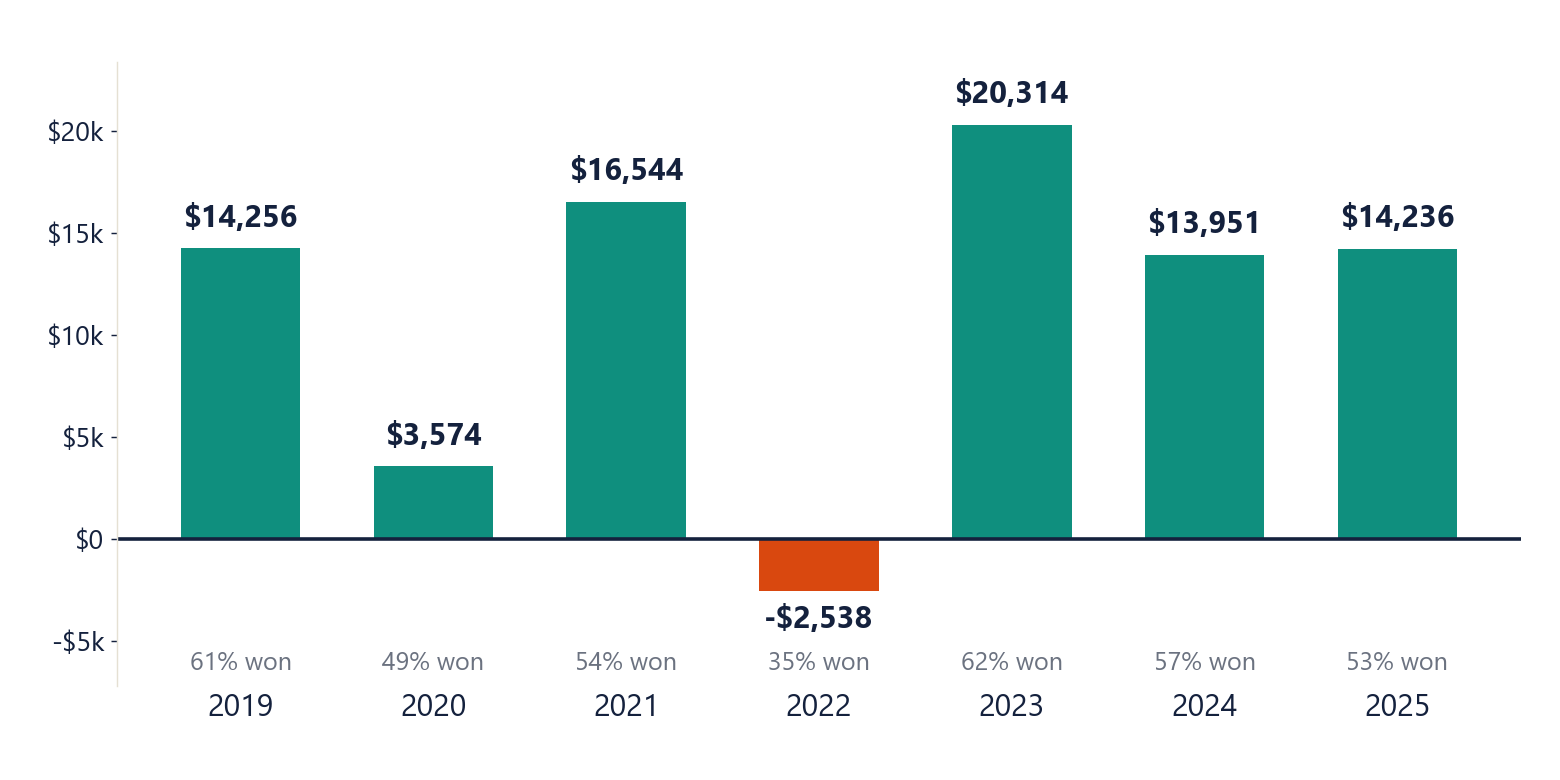
Six of seven years made money and 2022 did not, about $2,538 lost on that one-contract basis while QQQ fell about 33%. We are not going to dress that up. The win rate wandered between 35% and 62% depending on the year, which tells you how little a single year can say about a system.
Being underwater is normal
Here is the number that surprised even us. In those seven years the account sat below its previous high about 77% of the time. If your account always seems to be a little underwater, congratulations, you are normal. In 18 of those stretches the dip reached $1,000 or more, and the worst one took about 7 months to climb out of. 17 of them have finished and every one of those finished with a new high. The last one was still open when the test ended, which we would rather tell you than hide.
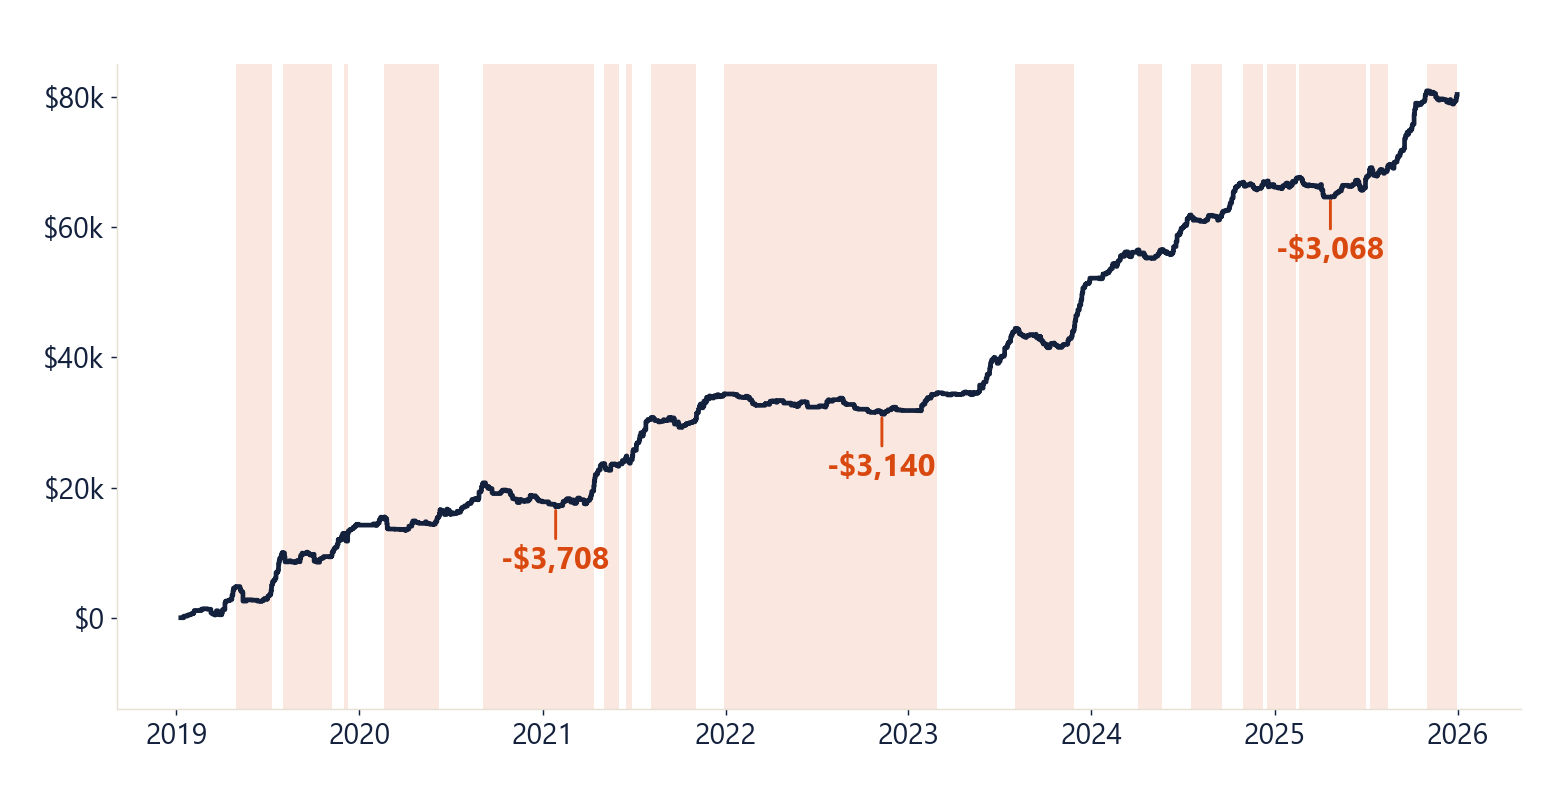
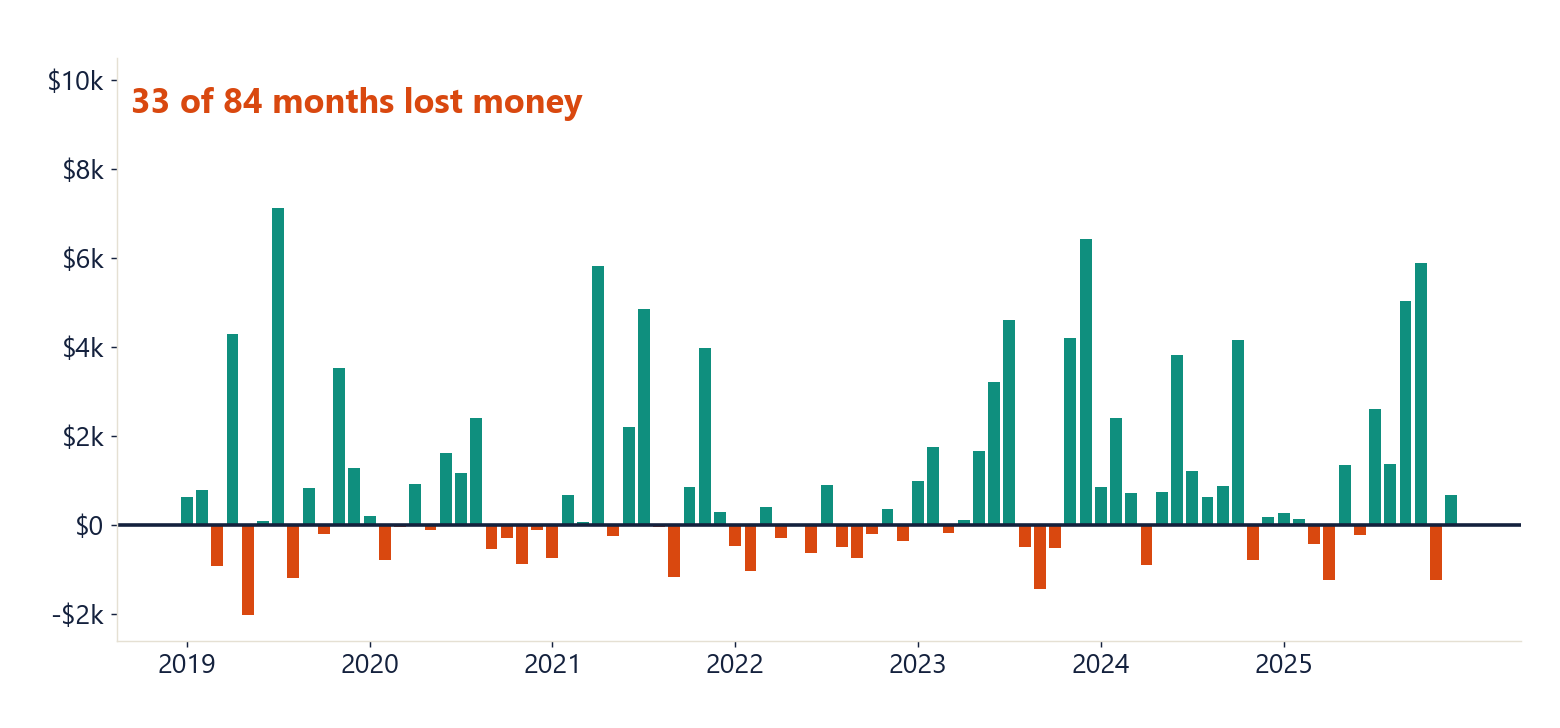
Losing months are part of the furniture too. 33 of the 84 months lost money, including some inside the best years.
The 25th loss
The streak is my favorite example. Across the whole test there were 61 runs of five or more losing trades in a row and 12 of ten or more, and the longest was 25, in February and March of 2020 while QQQ fell about 26%. Picture running that by feel. By loss number 25 you are done, and you would be forgiven for it, because nothing in your experience says this ends. That 25th loss closed on March 23, 2020, which was the S&P 500's closing low of the whole crash. The 46 trades opened over the next 60 days won 72% of the time.
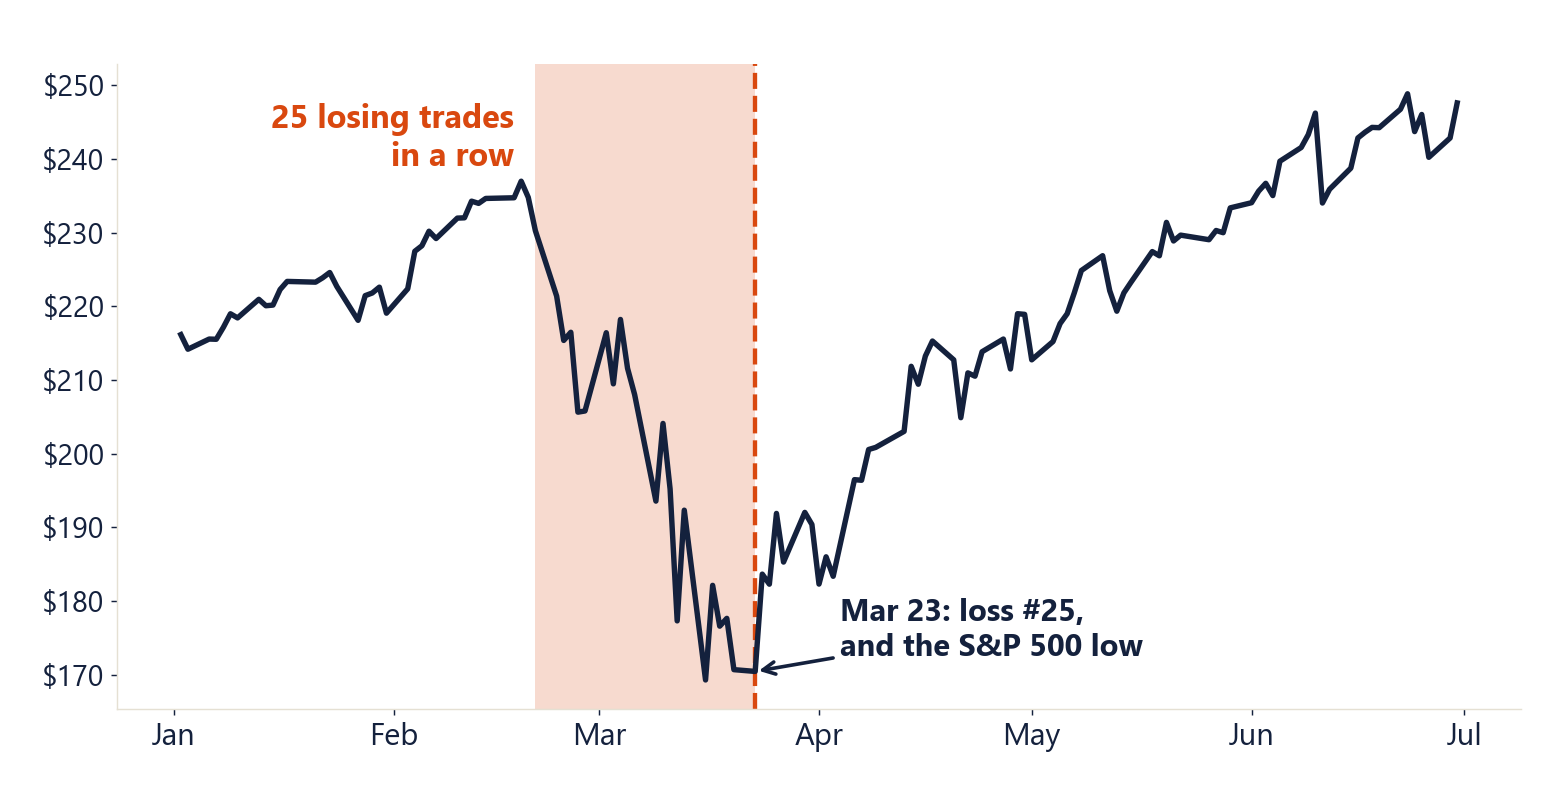
Nobody could have known that in real time, which is the whole point. The rules did not need to know.
What came after every low
We ran the same check on all 17 finished drawdowns. The six months after each low were positive all 17 times, and the median gain was about 4.4 times what the drawdown had cost. Quit at the low and you skip exactly that part.
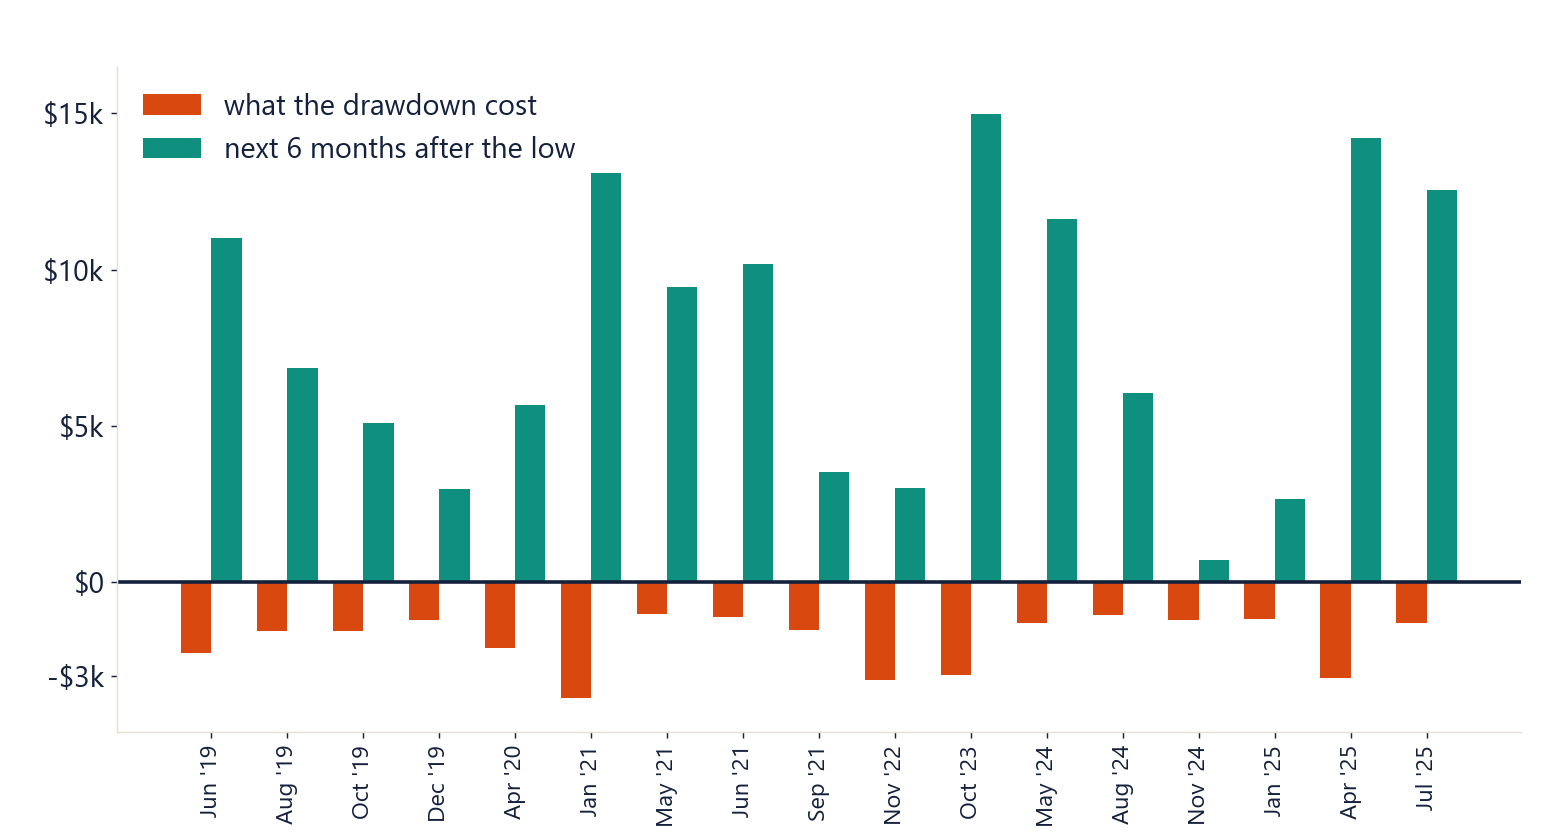
How the system came back from the last three crashes
Now the part where we get to brag a little. We took the S&P 500's closing low from each of the last three crashes and asked what the backtest did over the next six months. After the Mar 2020 low it made $6,296, after Oct 2022 it made $2,570, and after Apr 2025 it made $10,952 (one contract per trade, so think of those as units, not a paycheck). Every time, the system was still there when the market turned.
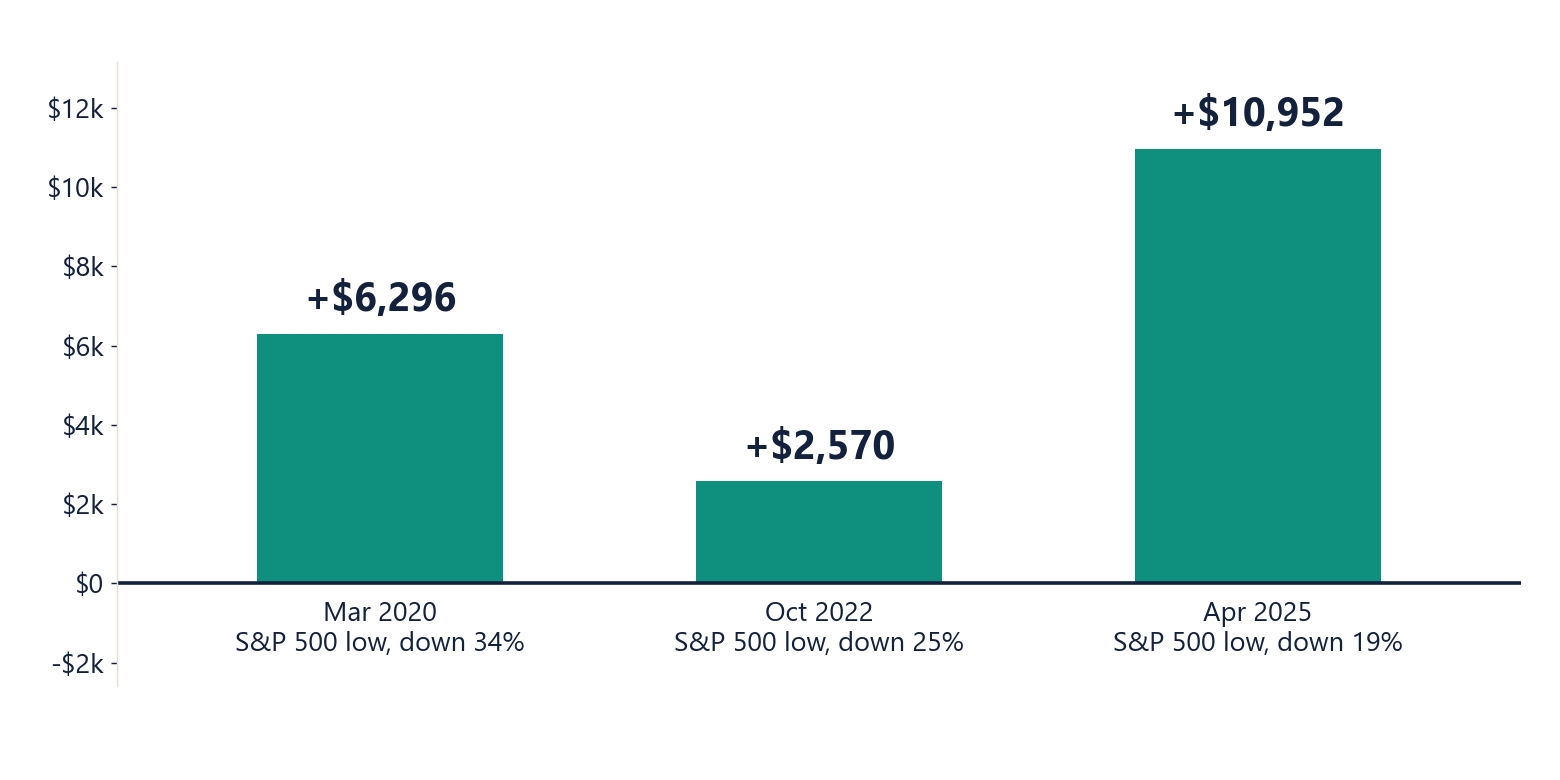
Last year is the freshest example. The S&P 500 hit its low on April 8, 2025 after falling almost 19%, and Maya's live account launched right after it. By June 30 it was up about 19%, and it finished 2025 up about 38% since launch on a $30K account, open trades included. That is the live record, not the backtest, and we are proud of it. We also know one good stretch proves very little, which is exactly why we keep pointing you back to the long test.
This is what discretionary trading cannot give you
A discretionary trader hits a bad stretch with nothing to check it against, because the trades never repeat the same way twice. Every drawdown is the first one. A system repeats, so a drawdown has a record, and you can look up what happened the last 17 times before you decide this is the time to panic.
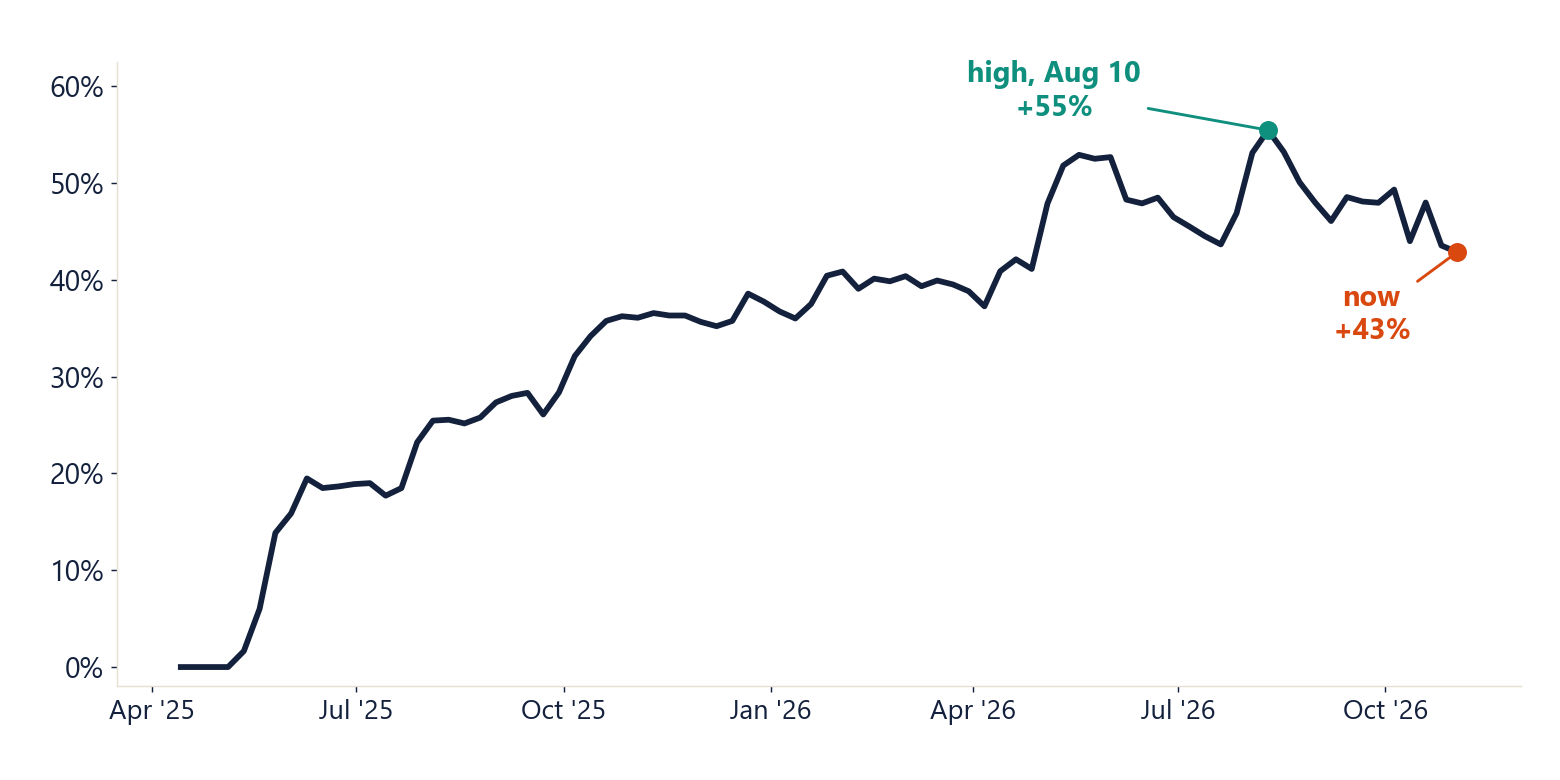
The live account has the same texture, with the usual caveat that live runs a little under a backtest. Maya's live ROI is sitting about 13 points under its Aug 10 high as I write this. The dip before it, about 9 points from May to July, ended in a new high. That is a record and not a promise, and we would rather you see it here than find out later.
So what do I do with this?
So backtest it, then backtest it again, and then trust the system you tested. If you want to see ours, every Maya trade, winners and losers, is public at tradewithmaya.com/maya-public, and Maya AutoTrading lets the rules, not your gut, make the call (the signals come from Maya and PeakBot submits the orders to your own brokerage account). Whatever you trade, write down the worst case before you start, and when the account is down, check the record before you check your feelings. Your gut has a perfect track record of buying excitement and selling despair, and it does not need the extra practice. That is my read, not advice.
Share this post
Comments 0
Leave a Comment
No comments yet. Be the first to comment!
Stay Updated
Subscribe to our newsletter for the latest trading insights and updates.
Autotrading is Live
Maya sends the signals. PeakBot submits the orders to your brokerage. You never lift a finger.
See How It WorksThe Books
Trade Like a Machine
Build a rules-based options trading system