Is QQQ Making a Double Bottom? How to Spot a Real One From a Fake
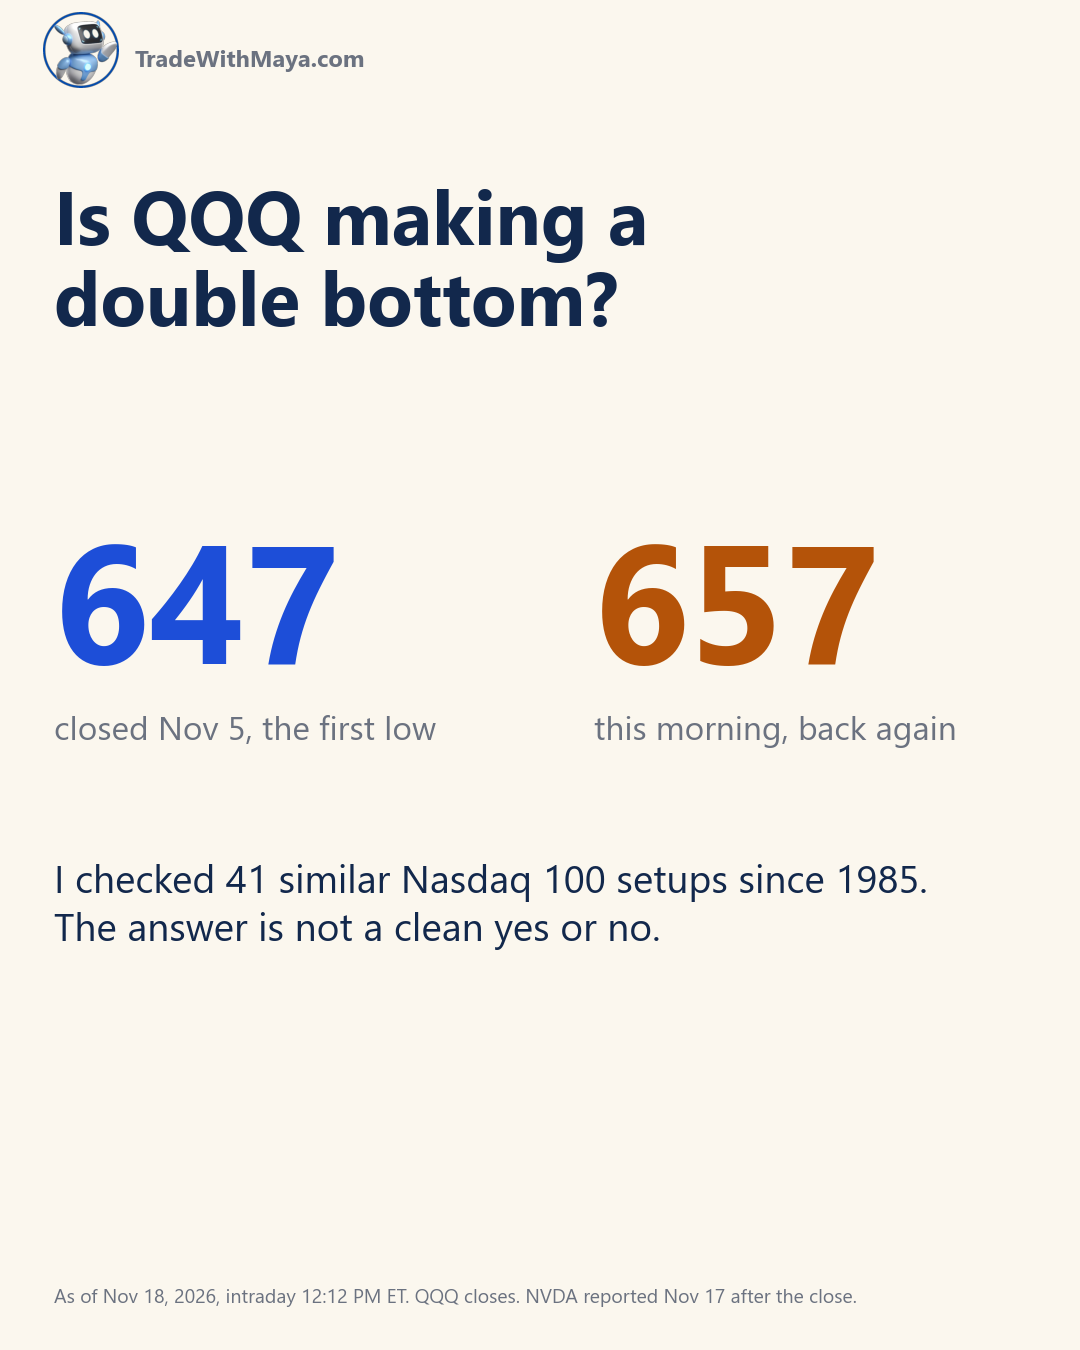
I have been staring at the QQQ chart since Monday, because it is doing the thing every chart reader wants to see right before they get fooled. QQQ closed at 647.05 on Nov 5, bounced, and this morning it is back around 657. A double bottom, right? Chart patterns are a lot like faces in clouds: easy to see when you want to. We see double tops and double bottoms all the time, and most of them go nowhere. A few mark real turns. So here is how I tell them apart.
What a double bottom is
An index falls, finds a low, bounces, then falls back to about the same level and holds. Two lows at roughly the same price make a W. The idea is that sellers tried twice to push it lower and failed twice. The high of the bounce in the middle is the neckline, and the pattern is not confirmed until the price closes above it. Flip it upside down and you get a double top, which is the same story in reverse.
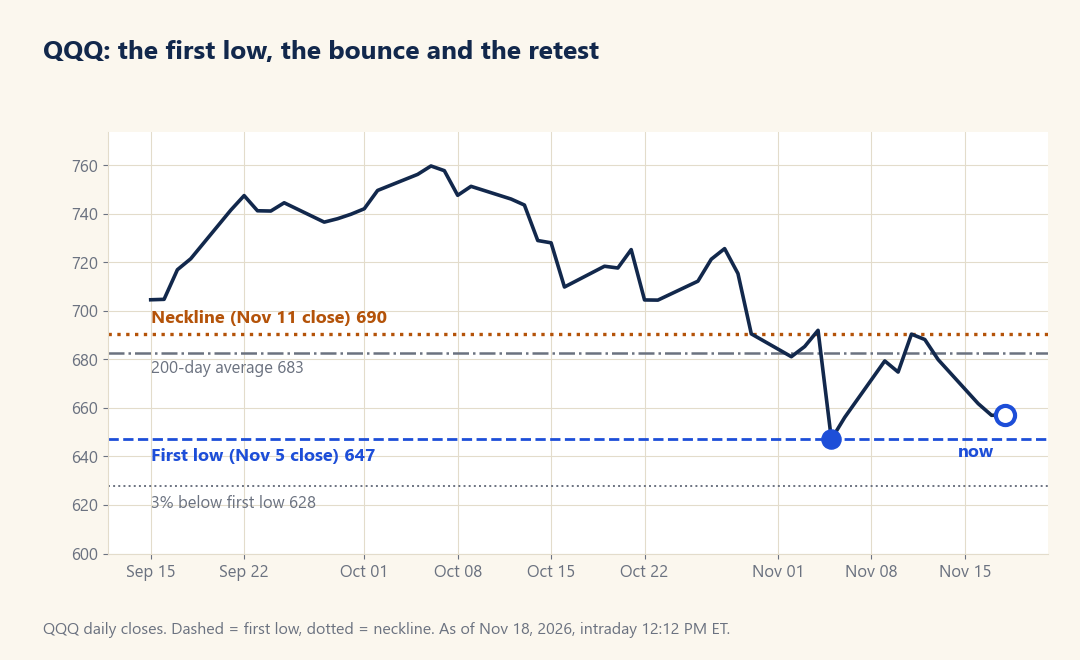
Here is where QQQ stands. It closed at 760 on Oct 6, then fell 15% to 647.05 on Nov 5. It bounced 6.7% to 690.38 on Nov 11, and this morning it is back around 657, only 1.5% above the first low. That is 9 trading days after the first low, so a possible second bottom.
The last real one, and the last fake
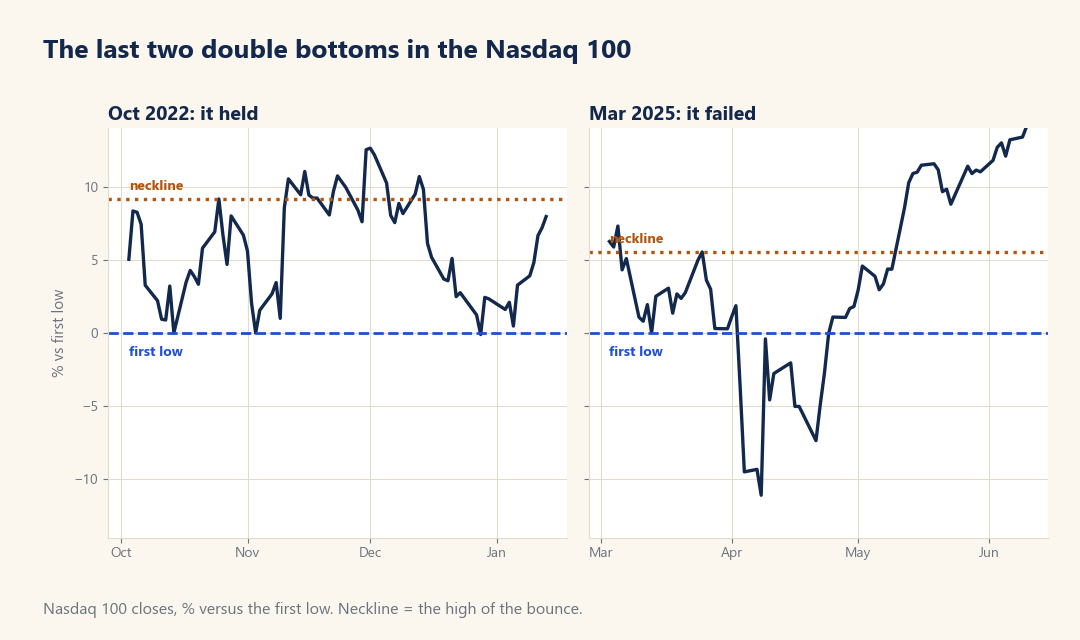
The last real double bottom in the Nasdaq 100 was October 2022. The index hit 10,692 on Oct 14, bounced to 11,670, came back to retest the low on Nov 2, and held. It closed above the neckline on Nov 11, just 7 trading days later, and was up 15% three months after the retest. The low never broke.
What made that one real was the speed. On Nov 10 the Nasdaq 100 jumped 7.5% in a single day on a softer inflation report, and that one candle did the job of the whole confirmation. Buyers did not creep back in, they showed up all at once. That is what a reclaim with conviction looks like. It was also a different backdrop than 2008 or 2001: the Fed was still hiking, but the index had already fallen 25%, a lot of bad news was already priced in.
The last fake was March 2025. First low 19,225 on Mar 13, a bounce to 20,288, a retest two weeks later. It looked the same on the chart. Then came the tariff selloff, and the Nasdaq 100 fell to 17,090 on Apr 8, about 11% under the first low. The neckline did not come back until May 12, 31 trading days after the retest. A lot of people who bought the W got shaken out first.
Here is how the fake played out. The index lost 5.4% on Apr 3 and another 6.1% on Apr 4, a two day move that took it well through the 3% line. Anyone who followed the rule and left on the first close under the line took a small loss. Anyone who held on hope took the full 11%. Then on Apr 9 it jumped 12% in a day and the whole thing turned into a V, but you could not have known that on Apr 8. This is the main reason I like having the 3% line written down before the trade: the fake and the real look identical until the day one of them breaks.
So I counted
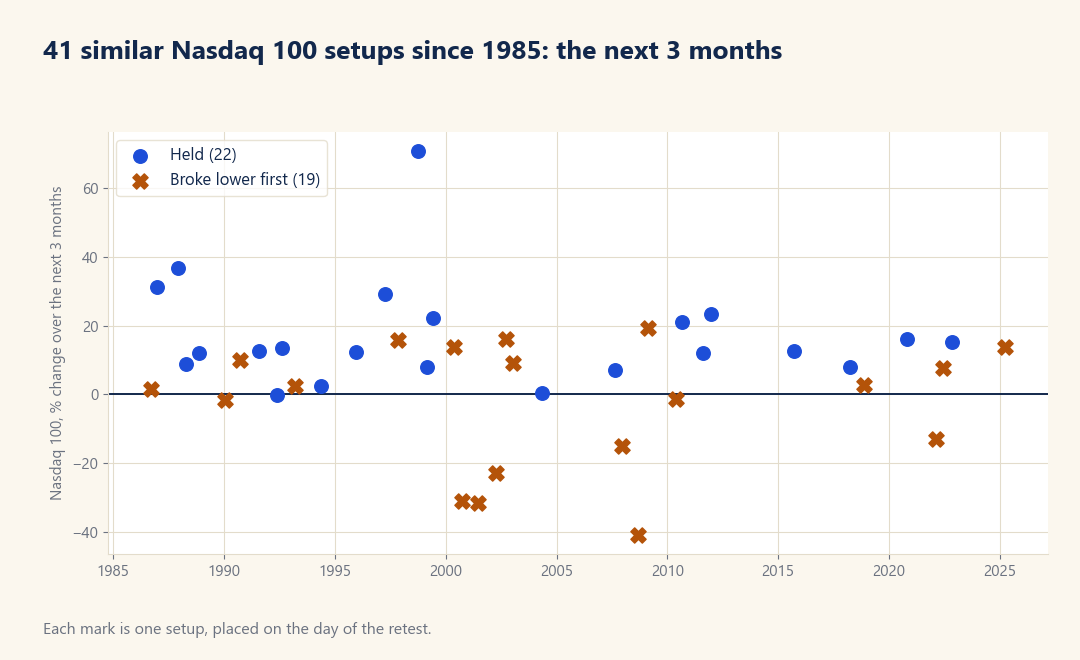
I went back through the Nasdaq 100 to 1985 for the same setup: a drop of 10% or more, a bounce of at least 5%, then a return to within 3% of the low a few weeks later. That gave 41 cases. 22 held and 19 broke more than 3% lower before turning, so a second low near the first is close to a coin flip. 32 of the 41 were higher three months later, though, and 33 were higher a year later.
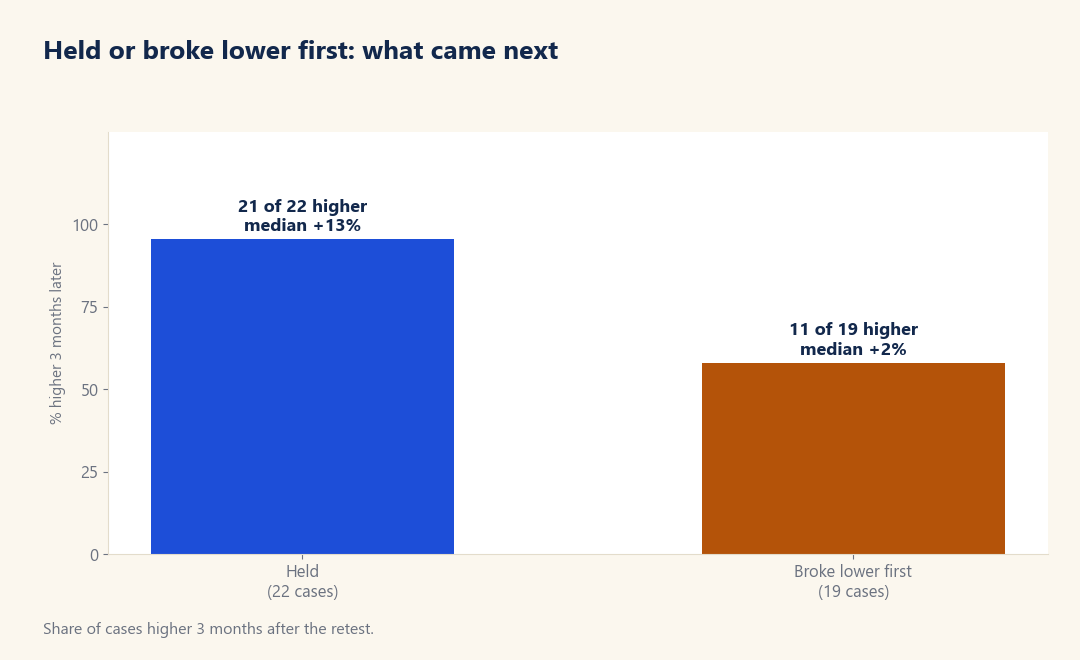
When the low held, 21 of 22 were higher three months later, with a median of +13%. When it broke first, 11 of 19 were higher, with a median of +2%.
How to spot a fake from a real one
1. Does it reclaim the neckline? This is the one that matters. 32 of the 41 setups eventually closed above the neckline, usually within about 14 trading days, and 24 of the 32 with enough data were higher three months after that close (median +7%). The 9 that never got there all broke lower. For QQQ the neckline is a close above 690, which sits just above the 200-day average at 683, so expect that area to act like a wall.
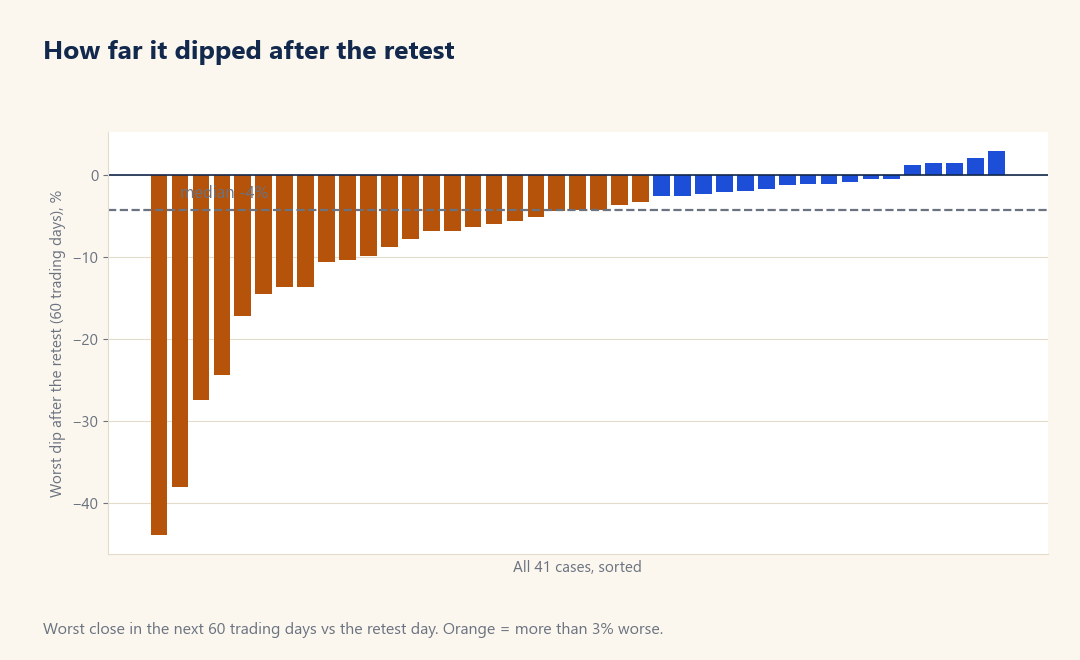
2. Does the second low hold within 3% of the first? A real double bottom shows the same low twice. If QQQ closes under 628, that is the fake. The typical worst dip after the retest was about -1% when it held and about -10% when it did not.
3. Skip the volume tell. The textbook says the second low should come on lighter volume. In QQQ's own volume since 1999 that happened in 19 of 24 cases, and 12 of those 19 still broke lower. Do not lean on it.
4. Check the backdrop. The worst failures were in real bear markets: 2000 to 2002 and 2008. A W in the middle of a bear market is just a pause. A W after a sharp correction in a market that was at records six weeks ago, which is where we are, has a better history.
How people trade it
There are two classic ways in, and they trade off price against certainty. The early entry buys the retest itself, near 657, with a stop just under the 3% line at 628. That risks about 29 points (4.5%). The late entry waits for the close over 690. You pay about 33 points more, and you have proof the buyers showed up.
The usual target is the measured move: take the height of the W, here 690 minus 647, which is about 43 points, and add it to the neckline. That puts the target near 734. In the 32 setups that confirmed and had enough data, 21 reached their measured move within 3 months of the confirmation. For the early entry that is about 77 points of reward against 29 of risk, a bit better than 3 to 1. For the late entry it is closer to 1 to 1, which is why many traders wait for a pullback to the neckline instead of chasing the breakout.
None of this needs a fancy platform. A chart, three levels and a written plan before the trade is all it takes. The plan is what keeps you out of the Apr 4 problem, where you are sitting on a position and making up the rules as you go.
Double tops, the same thing upside down
Everything above works in reverse for a double top: two highs at about the same level, a pullback between them, and a confirmation when the price closes under the middle low. The same tells apply. Does it lose the neckline? Does the second high stall at the first, or push through it by more than a few percent? Does the backdrop look like a market that is already weak? A double top that gets reclaimed is a bull trap, the mirror image of the fake bottom. Both patterns are showing up constantly, on every stock and every timeframe, which is exactly why the filter matters more than the shape.
The 60 second checklist
1. Is the second low within 3% of the first? 2. Has it closed above the neckline yet? 3. Where is the 200-day average, and is the neckline near it? 4. How big was the first drop, and is this a correction or a bear market? 5. What event is coming that can break the pattern in one candle? Right now the answers are: yes, not yet, the neckline sits just over the 200-day at 683, a 15% correction after records, and NVDA, which beat but did not rally.
NVDA: why I think it is a buy
NVDA reported on Nov 17 and it was a good report. Revenue was $115.8 billion against about $109.1 billion expected, and the company guided next quarter to $130 billion against about $125 billion expected. Nobody was counting on guidance with the CEO situation, and they gave it anyway, with interim CEO Colette Kress running the call. The stock jumped about 5% after hours. Then it gave it back, and it is trading around 152 today, down 37% from its 239 high on Oct 6.
For me that is a screaming buy. A company growing revenue 103% a year is on sale, and it is on sale because of a leadership story, not a business story. I watched it fall into the print and thought the same thing.
Now the honest part. A stock that beats and raises and still cannot hold its gains is telling you something. The market is worried about who runs the place after Huang, there is a reported SEC investigation, and new export rules are still being studied. Part of that Q4 guide is also an extra week in the quarter. So I would not go all in on one day. I would buy it in pieces and decide in advance where I am wrong. This is my opinion, and I have been wrong before.
It also connects to the QQQ chart. NVDA is one of the biggest weights in the index. If it turns, the neckline at 690 gets a lot closer. If it does not, 628 comes into play.
What I am watching
Above, a close over 690. Below, a close under 628. In between, I treat it as undecided and keep size small. Maya's rules size up and down with market stress, so I do not need to guess which story we are in.
Share this post
Comments 0
Leave a Comment
No comments yet. Be the first to comment!
Stay Updated
Subscribe to our newsletter for the latest trading insights and updates.
Autotrading is Live
Maya sends the signals. PeakBot submits the orders to your brokerage. You never lift a finger.
See How It WorksThe Books
Trade Like a Machine
Build a rules-based options trading system